Sunday 23 October 2022

I am a 9.5 in 10 (with apologies to UB40): social care employment statistics and people with learning disabilities

This blogpost is the third in a set looking at various aspects of the social care statistics recently published by NHS Digital for 2021/22, focusing on adults with learning disabilities in England. The first two blogposts gave an overview of trends in social care support and social care spending for adults with learning disabilities.

This blogpost updates previous posts on what the statistics say about the self/paid employment of working age (aged 18-64 years old) adults with learning disabilities in England. These figures are provided by local authorities every year, and since 2014/15 have only been provided for people getting long-term social care (before 2014/15 it was the larger group of people known to local authorities as a person with learning disabilities, even if they weren't getting long-term social care support). This means that these figures don't include the much, much larger group of adults with learning disabilities who aren't known to local authorities or GPs and who don't get any kind of support related to their learning disability.

It is important to note that these statistics are collected for financial years (April to March), so they will represent what was happening for adults with learning disabilities up to March 2022, through the continuing COVID-19 pandemic in England. It is also really important to say that the quality of this information has been questioned at the best of times – there are massive caveats about the extent to which local authorities would be able to collect this kind of information accurately throughout a pandemic.

Some of the numbers reported here are included in the Adult Social Care Outcomes Framework (indicator 1E, if you're interested), although some of the numbers are more buried in publicly available but less accessible CSV datafiles. 

What do the numbers tell us?

The first graph below shows the number of working age adults with learning disabilities that councils say are in any self/paid employment, broken down by whether people are in employment for 16+ hours per week or less than 16 hours per week (and 1 hour a week can count in these statistics). The gap between 2013/14 and 2014/15 is because of the change in data collection I mentioned earlier, so numbers before and after then can't be compared, and 2008/2009 was the first year that information was collected so it's rather dodgy for that year.


According to these figures, in 2021/22 there were 6,380 working age adults with learning disabilities getting long-term social care in any form of self/paid employment. After a couple of years of the number of people in paid/self employment edging towards 8,000, this is now the lowest number of people in paid employment since the first dodgy year of data collection in 2008/09. Consistent across the years is that most of the people in employment (71% of people in 2021/22) are working for less than 16 hours per week.

What do these numbers mean in terms of employment rates? The graph below shows the employment rates for working age adults with learning disabilities over the same time period. The columns show the overall employment rate - in 2021/22 this was 4.8%, compared to 76% for adults generally in March 2022. This is the lowest employment rate for adults with learning disabilities recorded since the statistics were changed in 2014/15.

The lines on the graph show employment rates for men and women with learning disabilities separately. Employment rates for men (the purple line) are consistently higher (5.3% in 2021/22) than employment rates for women (the blue line) (4.1% in 2021/22 with this gender employment gap staying fairly stable over time.


The last graph below sounds an appropriate note of caution about the reliability of information on self/paid employment provided by councils. This shows, for all working age adults with learning disabilities getting long-term social care, whether councils say they are: 1) in self-paid employment; 2) not in employment but actively seeking work (and presumably therefore liable to potential benefit sanctions); 3) not in employment but not actively seeking work. There is also a fourth category, where councils say they don't know the employment status of the person. 


Over time, the number of people whose employment status is unknown has decreased rapidly, from 44% of working age adults with learning disabilities in 2014/15 to 21% of people in 2021/22 (21% is still a big chunk, however). It is unclear how councils are making decisions about whether to record someone as actively seeking work or not.

Overall, this update shows, bearing in mind understandable caveats about the quality of the information that could be collected during the continuing COVID-19 pandemic, further reductions in employment rates (from a ridiculously low base) for working age adults with learning disabilities getting long-term social care, with most work being extremely part-time, and a gender employment gap. 

As far as we know, many more than 5.1% of working age adults with learning disabilities want to work. We know that secure, stable paid employment for people with learning disabilities is associated with better physical and mental health, and we know that supported employment is highly cost-effective. Building sustainable, fulfilling paid employment for people with learning disabilities, in our current circumstances of wide-ranging labour shortages, surely has to be an urgent ‘building back better’ priority? Perhaps the ambitions of the May 2022 Government adult social care reform white paper will be reflected in improved figures next year...

I got bills: Social care spending 2021/22 and people with learning disabilities

NHS Digital have recently released their annual tranche of statistics concerning social care for adults in England. This blogpost is the latest in a series about social care statistics concerning adults with learning disabilities in England, updating the statistics to include the latest 2021/22 figures. Because the reporting year for these statistics runs from April to March, these are the second set of annual statistics that might tell us something about the impact of the COVID-19 pandemic on social care services for adults with learning disabilities. When looking through these statistics it is important to remember the pressures local authorities have been under, which might have affected the quality of the information collected.

Councils with social services responsibilities return information to NHS Digital every year on how many adults are using various forms of social care, and how much councils spend on social care (this doesn’t include other types of state funding relevant to social care, such as housing benefit as part of supported living support). I've tried to use some of the statistics to answer three questions about spending on social care services for adults with learning disabilities (questions relating to how many adults with learning disabilities are using social care are in a previous blogpost).

Question 1: How much money are councils spending on social care services for adults with learning disabilities?

The graph below shows gross expenditure by local authorities on social care for adults with learning disabilities from 2014/15 to 2021/22, broken down by age band and categories of spending. It is important to remember that these figures do not include housing benefit (an essential component of supported living arrangements). These figures are also not adjusted for inflation, which as we enter a time of high inflation is going to be even more important to take into account. However, using 2014/15 as a baseline (there had already been real-terms cuts to social care budgets by this point), the graphs also includes lines of what expenditure would be if social care expenditure only increased in line with inflation, using adult social care inflation figures from the invaluable PSSRU publication Unit Costs of Health and Social Care (2021 edition)


A couple of observations. Overall, despite the number of adults getting social care decreasing during 2021/22, social services expenditure continued its steady upwards trajectory in absolute terms in 2021/22 at an annual growth rate of 4% from 2014/15. Local authority gross expenditure on social care for adults with learning disabilities totalled £6.5 billion in 2021/22, 30% of all local authority expenditure on adult social care. For both adults with learning disabilities aged 18-64 and adults with learning disabilities aged 65+, increases in expenditure ran slightly ahead of inflation. This indicates local authorities trying to protect these budgets, while at the same time falling short of what would be needed given projected increases in the population of adults with learning disabilities needing social care support.

The two line graphs below show trends in expenditure on specific types of social care service for adults with learning disabilities aged 18-64 and 65+ (with different scales for the two age groups). Spending on supported living continues to increase and has now overtaken spending on residential care - these two are by far the largest components of social care expenditure to support adults with learning disabilities.


Question 2: How much are people paying for social care in 'client contributions'?

When looking at the figures above on expenditure, it is important to remember that this is gross current expenditure - it does not take account of any income that might be coming into local authorities providing social care services. One source of income is 'client contributions' - money for social care support that is paid by people drawing on social care support or those close to them.

The two graphs below show the amount of income received by local authorities in client contributions for different types of social care support, for services for adults with learning disabilities aged 18-64 and for adults with learning disabilities aged 65+. As with the earlier overall expenditure graph, using 2014/15 as a baseline the graphs also includes lines of what expenditure would be if client contributions for social care only increased in line with inflation, using adult social care inflation figures from the PSSRU publication Unit Costs of Health and Social Care (2021 edition)

For both adults aged 18-64 and adults aged 65+, the biggest types of client contributions were for residential care and contributions under the 'fairer charging' regimen and its successors. Also for both age groups, client contributions over time have increased faster than inflation, and in total added up to £472.7 million in 2021/22, representing 7% of total gross social care spending.


Question 3: Are unit costs changing over time?

Unit costs for residential care and nursing care for adults with learning disabilities continued their upward trend in 2021/22 for adults aged 18-64. For adults aged 18-64, the average cost to local authorities of residential care was £1,726 per person per week and nursing care £1,568 per person per week. Unit costs were cheaper in 2021/22 for adults aged 65+ compared to adults aged 18-64 (£1,155 per person per week in residential care; £792 per person per week in nursing care), with unit costs decreasing for adults aged 65+ from 2020/21 to 2021/22. It is worth noting that unit costs are higher for these services for adults with learning disabilities aged 18-64 than for any other group of people getting social care.


Summing up

Social care spending for adults with learning disabilities reported in 2021/22 seems to continue longer-term trends, with increases just above inflation, continued increases in spending on supported living, and both supported living and residential care being the biggest types of social care spending. Client contributions also continue to rise faster than inflation year-on-year. There is a more mixed picture when it comes to the unit costs of residential and nursing care.

Given that there were 2,275 fewer adults getting social care at the end of March 2022 compared to the end of March 2020, with high inflation and staff shortages a present reality, what kind of a future are councils planning for? How much are councils spending on block contracts irrespective of whether people want to live there, and on 'voids' where people aren't even living? A future combining a high eligibility barrier with expensive, restrictive service options predominating seems the very opposite of value for money.


Friday 21 October 2022

The missing thousands - social care statistics 2021/22 and people with learning disabilities (1)

NHS Digital have recently released their annual tranche of statistics concerning social care for adults in England. This blogpost is the latest in a series about social care statistics concerning adults with learning disabilities in England, updating the statistics to include the latest 2021/22 figures. Because the reporting year for these statistics runs from April to March, these are the second set of annual statistics that might tell us something about the impact of the COVID-19 pandemic on social care services for adults with learning disabilities. When looking through these statistics it is important to remember the pressures local authorities have been under, which might have affected the quality of the information collected.

Councils with social services responsibilities return information to NHS Digital every year on how many adults are using various forms of social care, and how much councils spend on social care (this doesn’t include other types of state funding relevant to social care, such as housing benefit as part of supported living support). I've tried to use some of the statistics to answer four questions (questions relating to social care spending and employment will be in two follow-up blogposts).

Question 1: How many adults with learning disabilities were getting access to social care in 2021/22?

From 2014/15 the types of long-term social care support people get have been grouped into one of six mutually exclusive categories: residential care, nursing care, direct payment only, support via a personal budget partly including a direct payment, a council-managed personal budget, and council-commissioned community support only.

The first graph below shows the number of adults with learning disabilities aged 18-64 getting various types of personal budget or council-commissioned community support at some point during the year from 2014/15 to 2021/22), and also the number of adults aged 18-64 in residential or nursing care.


This graph suggests that some trends evident from 2014/15 to 2018/19 (before the COVID-19 pandemic) for adults with learning disabilities aged 18-64 have continued through to 2021/2022, while other trends have changed pace or reversed. 

Residential care has continued to reduce year-on-year from 26,975 people in 2014/15 to 21,880 people in 2012, as has nursing care (1,265 people in 2014/15 through to 1,035 people in 2021/22). The number of people getting social care in the form of direct payments increased from 2014/15 (21,580 people) to 2020/21 (28,015 people), but has levelled off in 2021/22 (27,930 people). The number of people getting social care at least partly in the form of a direct payment increased from 2014/15 (13,265 people) to 2019/20 (17,255 people), but has decreased since (16,265 people in 2021/22). The most common form of long-term social care support was the council-managed personal budget (the extent to which many of these feel any different to council-commissioned community services is debatable), which continues to increase over time (from 49,150 people in 2014/15 to 61,530 people in 2021/22). Finally, while the number of people getting council-managed community support decreased substantially from 2014/15 (12,000 people) to 2020/21 (4,900 people), this number increased sharply in 2021/22 (8.090 people).

In terms of residential and nursing care, the graph shows that although the number of adults aged 18-64 in residential care and nursing care continues to gradually decline over time, in 2020/21 they still represented 17% of all adults with learning disabilities aged 18-64 getting long-term social care.

In total 132,465 adults with learning disabilities aged 18-64 were getting long-term social care at some point in 2021/22. While there had been a steady trend of increasing numbers of adults with learning disabilities getting long-term social care year on year from 2014/15 to 2019/20, from 2019/20 to 2021/22 there have been two years of decreases in these numbers - there were 2,965 fewer adults with learning disabilities aged 18-64 getting long-term social care at some point in 2021/22 than in 2019/20. 

The second graph below presents the same information for adults with learning disabilities aged 65+. Please note that, because the number of people with learning disabilities aged 65+ using social care is much smaller compared to people aged 18-64, I have used a different vertical scale.


Unlike the figures for adults with learning disabilities aged 18-64, there is a continuous year-on-year upward trend in the numbers of adults with learning disabilities aged 65+ getting long-term social care, from 14,570 people in 2014/15 through to 18,405 people in 2021/22. 

The upward trend for the number of people in residential homes and nursing homes was interrupted in 2020/21 with a slight dip, but has resumed from 2020/21 to 2021/22, when 5,830 people were in residential homes and 860 people were in nursing homes. People getting long-term social care in the forms of direct payment only (620 people in 2014/15; 1,065 people in 2021/22), part direct payment (505 people in 2014/15; 785 people in 2021/22), and council-managed personal budgets (5,920 people in 2014/15; 9,350 people in 2021/22), with occasional fluctuations, have continued to trend upwards over time. The number of people getting council-commissioned community support has continued to decrease over time (1,430 people in 2014/15; 515 people in 2021/22).

For adults with learning disabilities aged 65+ getting long-term social care, 36% were getting this care in the form of residential or nursing care.

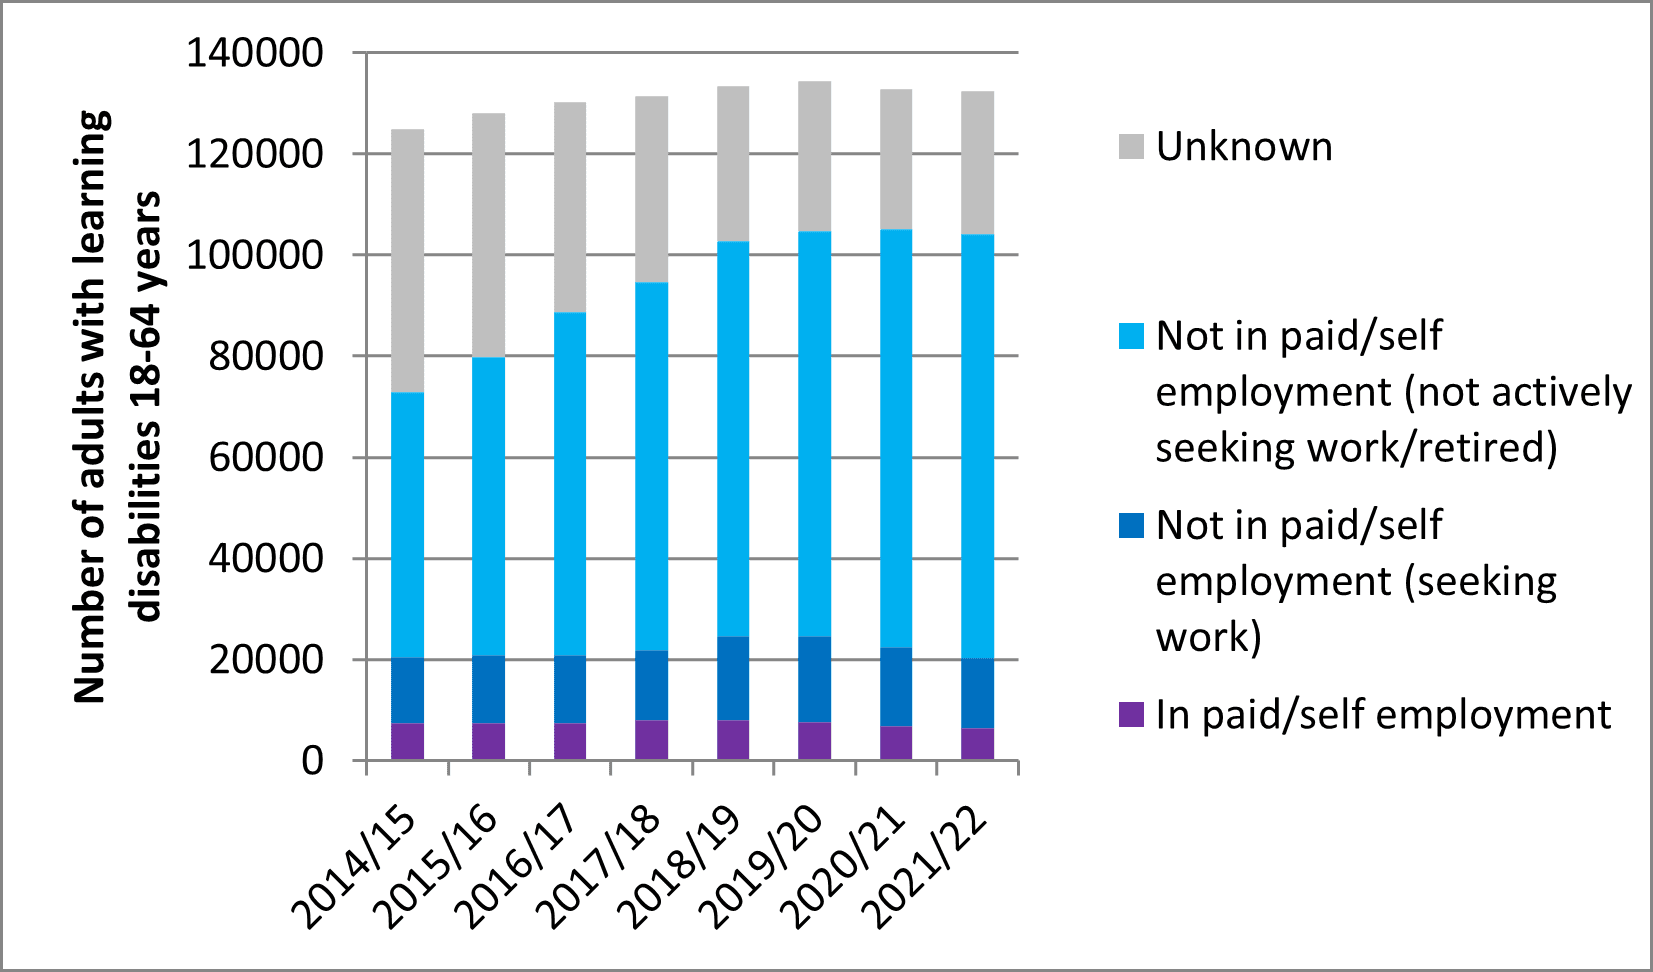
However, the statistics I’ve presented so far are for people getting long-term social care at some point in each year. This may under-estimate the impact of COVID-19 on the number of people currently getting social care, particularly where people have died during the year. The NHS Digital statistics also have snapshot figures on the number of people with learning disabilities getting adult social care at the end of each financial year, which we can compare to the number of people getting social care at some point during the year. The graph below shows this information for adults with learning disabilities aged 18-64, from 2014/15 to 2021/22. In 2020/21 and 2021/22, there is a clear reversal in the upward trend, with both people getting long-term social care at some point in the year (132,465 people) and people getting long-term social care support at the end of the financial year (124,635 people) falling for two consecutive years.


The next graph below shows the same information for people aged 65+, with a different pattern to people aged 18-64. The number of people getting long-term social care support at some point in the year continues to increase into 2021/22. The number of people getting long-term care at the end of the 2020/21 financial year dropped from 2018/19 to 2020/21, but increased again from 2020/21 to 2021/22. 


While these statistics are difficult to interpret, there were 2,275 fewer adults with learning disabilities of all ages getting long-term social care at the end of March 2022 compared to the same time two years before.

There is also the question of whether the number of adults with learning disabilities getting long-term social care is increasing in line with projected increases in the number of adults with learning disabilities needing social care. The graph shows the total number of adults with learning disabilities aged 18+ getting long-term social care support at any time in the year and at the end of each year, using the same overall format as the graphs above. Added to the graph are projected numbers of adults with learning disabilities requiring social care support, taken from population projections published in 2012 and baselined for 2014/15. There are two projections using dashed lines - the dark blue dashed line is the number of adults with critical or substantial needs only, and the light blue dashed line is for the number of adults with critical, substantial or moderate needs. 


As the graph shows, up to 2018/19 the number of adults getting long-term social care was just about keeping pace with the projected numbers of adults with critical or substantial needs (which is drawing the eligibility hurdle really quite high), but by 2021/22 the gap between the number of people projected to need social care and those actually getting social care was around 10,000 people. The gap is even greater if you take the projected number of adults with learning disabilities with critical, substantial or moderate needs (a gap of around 19,000 people in 2021/22).


Question 2: Where are people with learning disabilities living?

The headline social care statistics only report the living situations of people living in residential care and nursing homes (social care support for people in other living situations is characterised by whether they’re getting council-commissioned support or some form of personal budget). The number of adults with learning disabilities in residential and nursing care from 2014/15 to 2021/22 is in the graph below, broken down by whether people are aged 18-64 or 65+. For people aged 18-64, the trend is for a substantial decrease in the number of people living in residential care – a reduction of 19% in 7 years, with a similar percentage drop (18%) for adults aged 18-64 in nursing care. For adults with learning disabilities aged 65+, the number of people in residential care and nursing care has been gradually increasing up to 2019/20 (although with dips in 2017/18 and 2020/21). 


More hidden in the social care statistics is more detailed information on where local authorities think that adults with learning disabilities aged 18-64 who are getting long-term social care are living (a holdover indicator introduced, along with employment, with Valuing People). The monster graph below stacks up all the different types of living situation, from 2014/15 to 2021/22 (again note the ominous decreases in 2020/21 and 2021/22). 


To hopefully make this a bit more digestible, I’ve picked out trends for the most common types of living situation in the graph below. As the graph shows, the most common (and increasing up to 2019/20) living situations for adults with learning disabilities aged 18-64 were not residential or nursing care. By far the most common living situation was people living with their families (47,835 people in 2021/22; 36% of people recorded in this database). Over 30,000 people were living in some form of supported accommodation in 2021/22 (31,960 people; 24%), over 20,000 people were tenants or owner-occupiers (20,035 people; 15%) and 3,375 people (3%) were living in a Shared Lives arrangement. Throughout the COVID-19 pandemic adults with learning disabilities in all these living situations (and that’s without thinking of the majority of adults with learning disabilities, who do not get any social care support) were not exactly at the front of the queue when it came to government guidance, support with PPE and the essentials of daily life, repurposing much-needed social care support, and support to ensure that support workers could minimise the COVID-19 risks to themselves and the people they were supporting. 


Question 3: What happened to people trying to get a social care service?

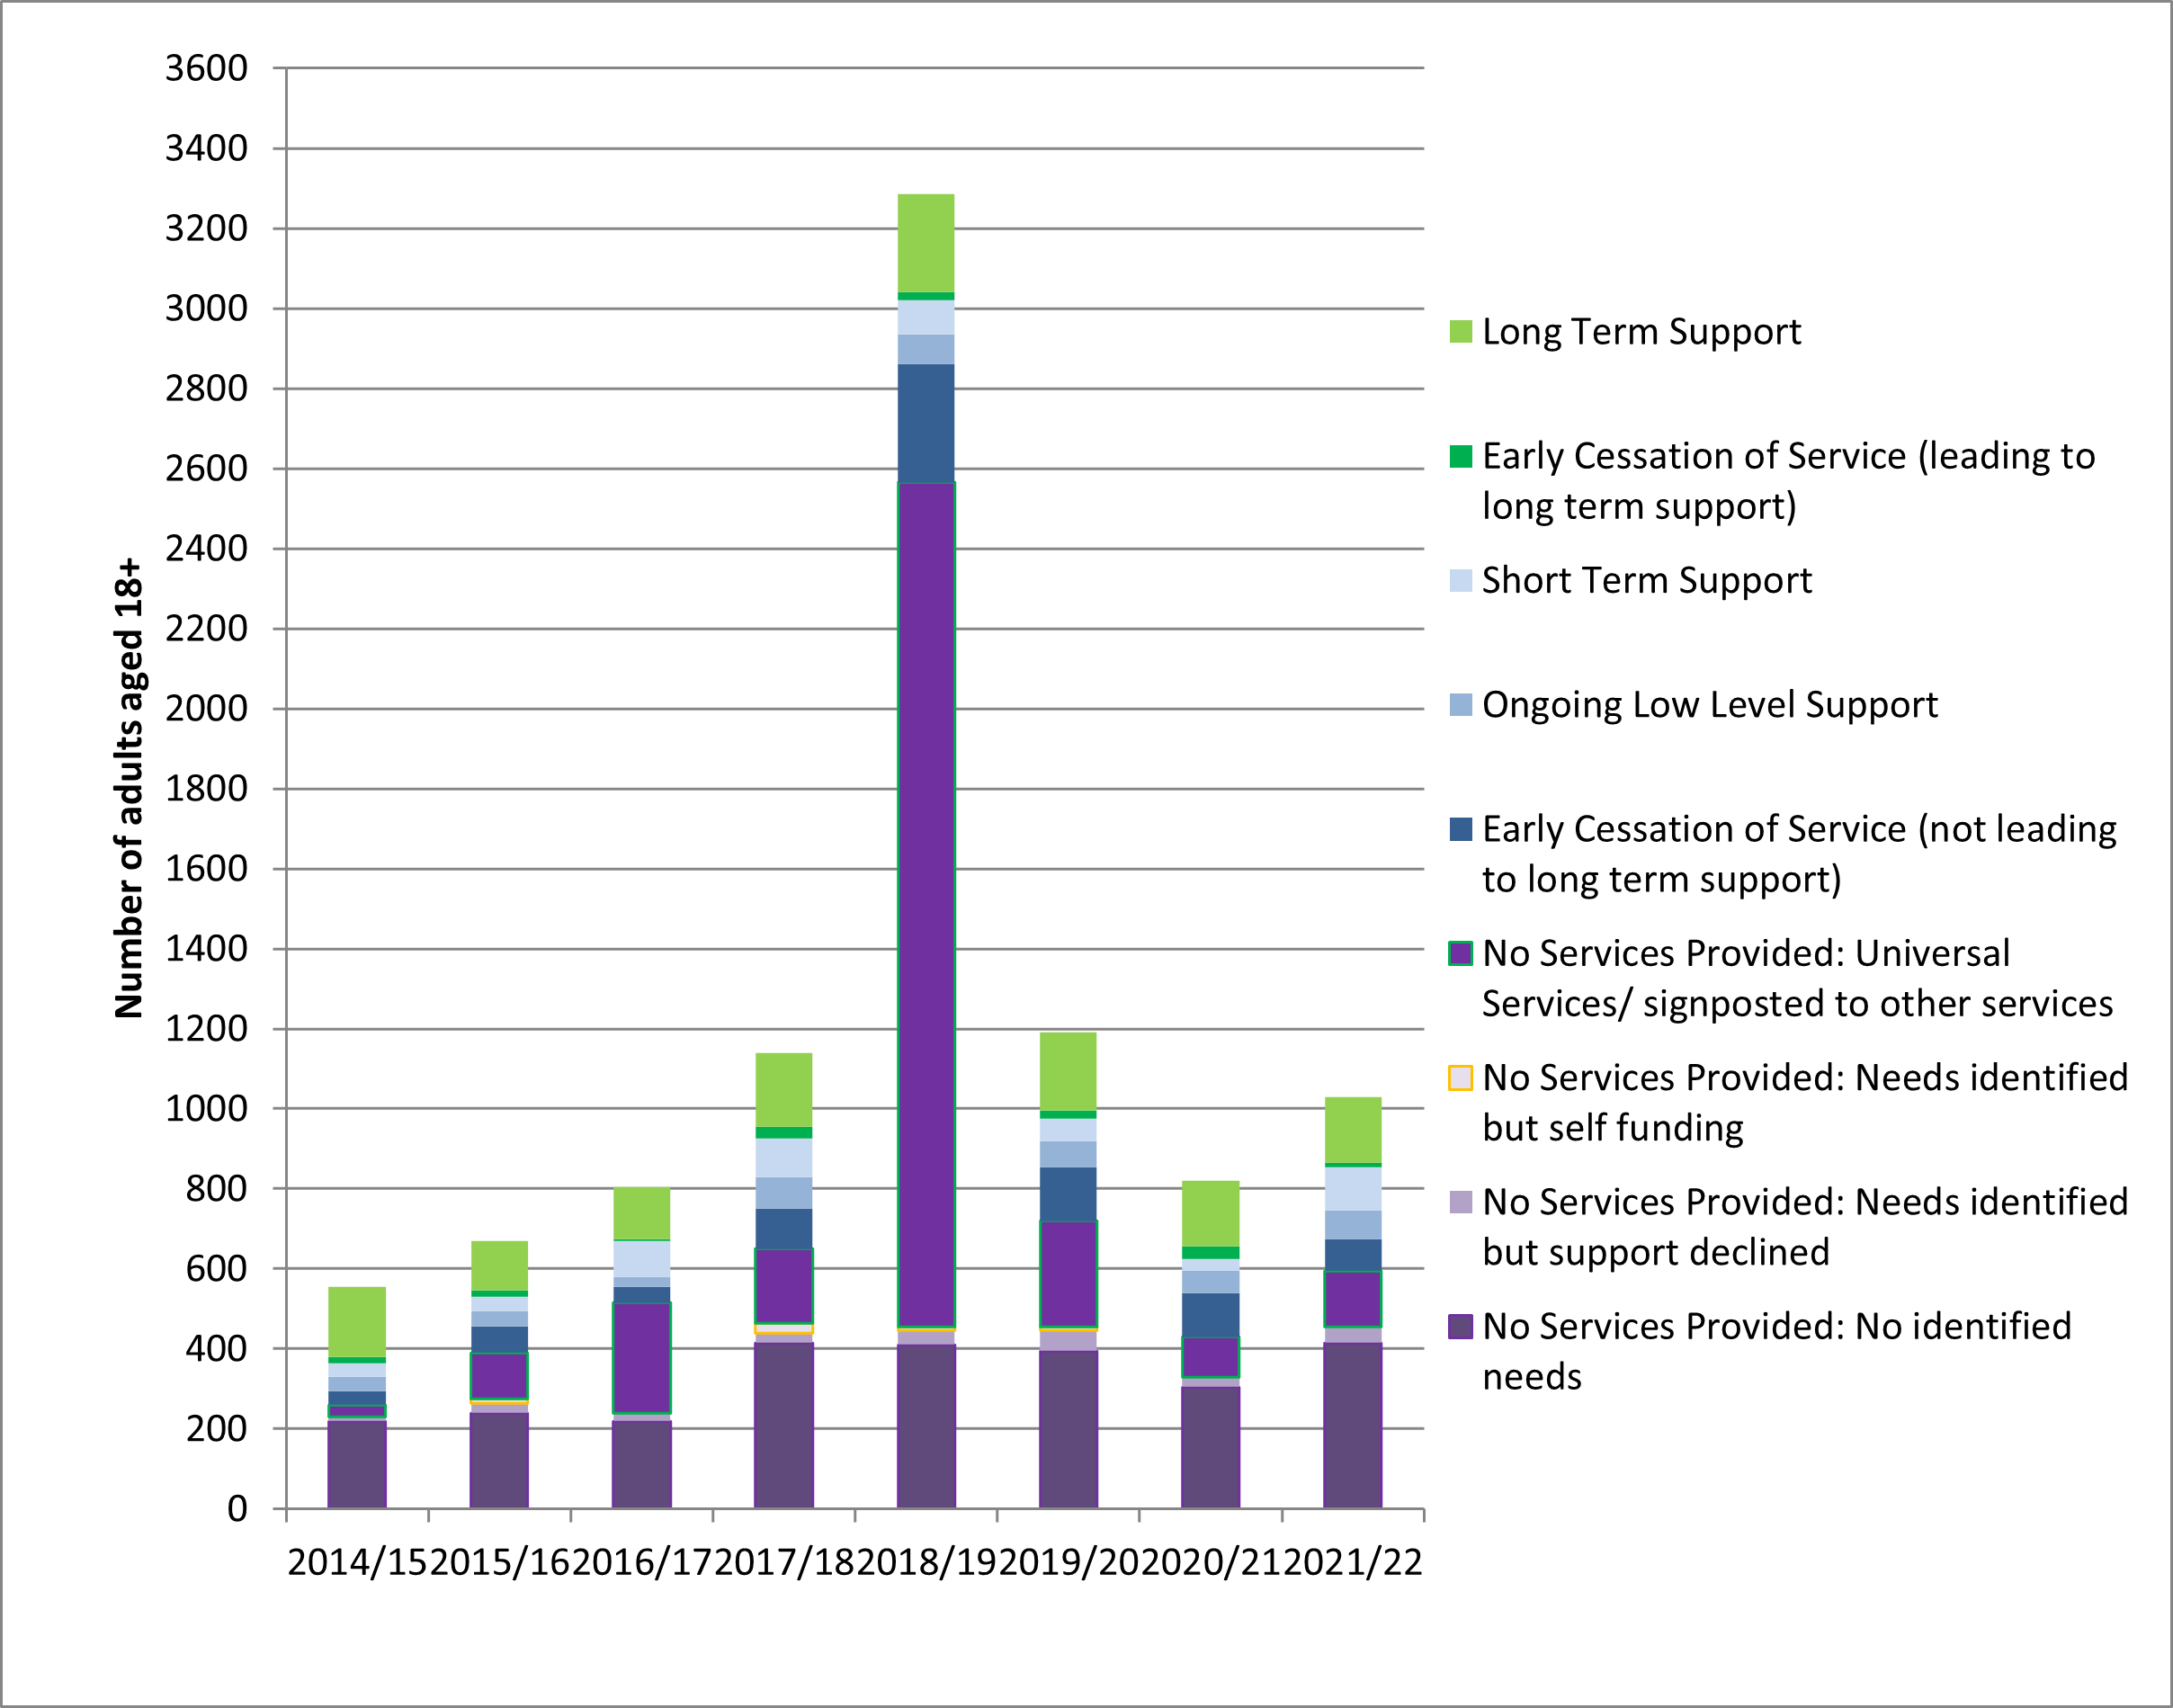
Although it is limited, adult social care statistics also include information on new people coming to the attention of social care services, and what happens to them after a ‘completed episode of short-term care to maximise independence’ (which to my untutored eye looks functionally equivalent to assessment). The graph below shows this information for all adults with learning disabilities aged 18+, from 2014/15 to 2021/22. Looking at the graph, 2018/19 looks like a bit of an anomaly, largely due to much higher numbers of people being signposted to universal services or other forms of non-social care support than in any other year. There seems to be an upward trend in the number of adults with learning disabilities coming to the attention of social services from 2014/15 to 2018/19, followed by a decrease from 2018/19 through to 2020/21, and a recent increase from 2020/21 to 2021/22 (although not to the levels of 2019/20).

In terms of what was happening in 2021/22, 1.030 adults with learning disabilities (almost all of whom were aged 18-64) came to social services as new clients.

Of these, 40% (415 people) were identified as having no needs and therefore requiring no services. For 14% (140 people) the response from social services was to signpost people to universal services or other forms of non-social care support. Almost one sixth of people (180 people; 17%) went on to get some form of low level or short-term support from social care, with a similar number (175 people; 17%) going on to get some form of long-term social care support. Very few (40 people; 4%) declined a service that was offered. 


Throughout the two years of the pandemic, the number of adults with learning disabilities coming to the attention of social care has been lower than in any of the previous three years, with a minority of this group getting any form of social care support during the COVID-19 pandemic beyond signposting elsewhere. 

Question 4: What do adults with learning disabilities think about the social care services they're getting?

At the same time as the publication of the 2021/22 social care statistics, information from the latest Personal Social Services Adult Social Care Survey for 2021/22 was also released by NHS Digital. This is administered by councils to thousands of adults making use of social care services every year, and asks (in carefully developed and tested standard and easy read formats) a range of questions about people's experiences of social care services and about people's wellbeing and health.

The graph below presents information from this survey from 2014/15 to 2021/22 for three groups of adults getting social care services; people with a primary care need of learning disabilities, people with a primary care need of physical support, and people with a primary mental health care need. The responses to four questions are summarised in the graph. For most groups, in response to the four questions at almost all time points there is little change over time (the exception being the percentage of people with learning disabilities saying they were not depressed or anxious, which increased by 16% in 2018/19 and has stayed at this higher level since), and overall people with learning disabilities report a consistently much more positive experience than the other two groups of people.

The general lack of change over this time period, when things have got harder for a lot of people getting social care and including the COVID-19 pandemic (although many groups were marginally more positive in 2020/21, at the height of lockdowns, than before or since), reinforces other research suggesting that these kinds of questions can be relatively insensitive to changes in people's circumstances.

The higher positivity of people with learning disabilities may be a genuine difference - it may also partly be a function of different question formats (people with learning disabilities are more likely to answer easy read format questions than other groups), and partly because people with learning disabilities were more likely to get help to answer questions, particularly from care workers, than the other two groups.


Summing up

To sum up, it seems like the continuing impact of the COVID-19 pandemic and the response of social care services to the pandemic has magnified some longer term trends in social care services, while putting other trends into reverse. The big, and grim, difference is that 2,275 fewer adults were getting long-term social care at the end of March 2022 compared to the end of March 2020, reversing a long-term trend of year-on-year increases. The gap between the number of adults with learning disabilities likely to need social care support and those getting social care support is now into the tens of thousands. This is particularly acute amongst adults aged 18-64 rather than adults aged 65+. Fewer requests for social care support are coming through to local authorities, and only a minority of these requests result in social care support.

There is also a question about how sensitive these statistics are to the seismic changes to people’s social care support that people with learning disabilities have been reporting throughout the COVID-19 pandemic. For example, in the Coronavirus and people with learning disabilities project many people reported paying for social care services they weren’t currently getting, getting less of a service than they used to, or some services which involved going out being replaced by online services, none of which would be picked up by these statistics. This research project also reports changes to people's health and wellbeing over time that are not being picked up by the Adult Social Care Survey.