A recent blogpost gives some context on the number of people with learning disabilities and autistic people who have been in inpatient services in England through the COVID-19 pandemic, using the same dataset as the one I will be using in this blogpost. It might be worth you having a quick look at that first, but a couple of headlines from that is that it looks like there were substantial dips in the number of people in inpatient services at times when the COVID-19 pandemic was peaking, with high pressure on health services and nationwide lockdowns. There have been increases in the number of people in inpatient services after these periods, but not to the levels seen before the pandemic. These dips in numbers were proportionally higher for children and young people and people not on formal sections.
The dataset I used in that blogpost and in this one is the Mental Health Services Data Set (MHSDS) - this is a large dataset collected by all NHS-commissioned mental health services in England, and includes information on people flagged in these services as an autistic person or a person with learning disabilities. NHS Digital extracts the information specifically related to people with learning disabilities and autistic people in any mental health inpatient service every month, including both the 'specialist' inpatient services that have largely been the focus of Transforming Care/Building The Right Support, and general mental health inpatient services. Providing information for the MHSDS is mandatory for NHS funded service providers, including independent sector providers.
What does the MHSDS say about restrictive interventions?
The MHSDS includes information on both the number of people subject to any restrictive intervention in any single month, and the number of restrictive interventions people have been subject to in any single month. It also provides information on a range of specific types of physical restraint, and on mechanical restraint, chemical restraints, seclusion and segregation.
What do the MHSDS statistics say about restrictive interventions overall? The graph below shows the number of people with learning disabilities and autistic people in inpatient units who have been subject to at least one restrictive intervention in each month, from January 2020 through to August 2021. There are particular spikes in May and July 2020, which I'll come to later, but the overall picture is of fluctuating numbers of people subject to restraints over time.

Because the number of people in inpatient services also fluctuates over this time period, we can also look at what percentage of people in inpatient units in each month are subject to at least one restrictive intervention. This is what the graph below shows - again there are the spikes in May and July 2020, but overall the trend looks to be increasing over time. In January 2020, 7.5% of people were subject to at least one restrictive intervention. By August 2021 this was 9.1% of people.

As well as the number of people subject to restrictive interventions, we know that people can be subject to multiple restraints, so the graph below shows the total number of restrictive interventions that autistic people and people with learning disabilities in inpatient services were subject to each month. Again, we see substantial fluctuations month by month throughout the pandemic, with potential dips when there were fewer people in inpatient units.

To take this into account, the graph shows the average number of restrictive interventions for every person that was subject to at least one. This again shows fluctuations over time, with a potential increasing trend until the summer of 2021. On average, people were subject to around 10 restrictive interventions in every month - one every three days.

The publicly available information also allows us to look at restraints that people in different age groups have been subject to. To simplify things a bit I've looked at four age groups: children and young people aged under 18; adults aged 18-24; adults aged 25-35; and adults aged 35+. The graph below shows the percentage of people in inpatient units in each age group who have been subject to at least restrictive intervention in each month. As the graph shows, people aged 18-24 are consistently most likely to have been subject to restraint - even setting aside the May and June 2020 spikes, around 13-14% of people in this age group experience restraint in each month.

Following on from this, how many restrictive interventions are people in different age groups subject to? The graph below shows that children and young people aged less than 18 are consistently most likely to experience more restrictive interventions in each month - in some months more than 20 restrictive interventions per person subject to at least one.

What restrictive interventions are people subject to?
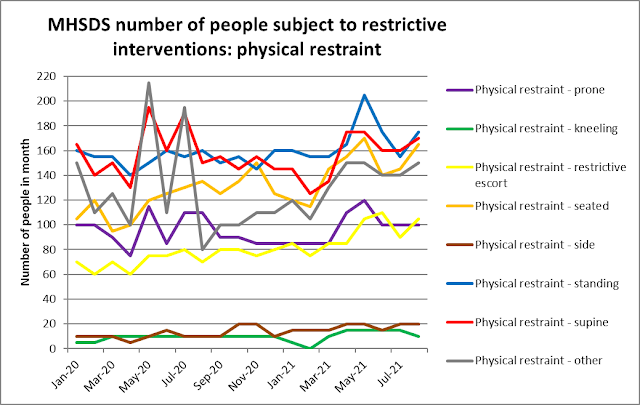
What do the statistic tell us about which types of restraint people with learning disabilities and autistic people in inpatient units have been subject to throughout the COVID-19 pandemic? The graph below shows the number of people who have been subject to different types of physical restraint throughout the time of the pandemic, according to the MHSDS.
The highest numbers of people are subject to four types of physical restraint (which may be increasing over the time of the pandemic): standing restraint, supine restraint, seated restraint and 'other' physical restraint. By August 2021, at least 150 people were subject to each of these types of physical restraint (and I don't understand why 'other' restraint should be increasing over time - what types of physical restraint are being put into that mysterious box?). It is also worth noting that prone restraint is still happening and being recorded - 100 people per month experience prone restraint.
How many times are people being subject to physical restraints? The graph below shows the total number of instances recorded of different types of physical restraint. The same four types of physical restraint discussed above are also the ones most commonly used: there are potential decreases over time in the number of times supine and standing restraint have been used, but a definite increase in the recording of 'other' restraint.

We can also look at the same type of information for other forms of restrictive intervention: chemical restraints, mechanical restraint, seclusion and segregation. The graph below shows the number of people subject to these forms of restrictive intervention. Seclusion is experienced by a large and increasing number of people across the pandemic period, up to over 160 people in the month of August 2021. Oral chemical restraint and rapid tranquilisers are each experienced by around 80 to 100 people every month, with the number of people subject to oral chemical restraint more than doubling from January 2020 to August 2021.

In terms of the number of times people have been subject to these forms of restrictive intervention, the graph below shows a similar picture, with high use of seclusion throughout and high and increasing use of oral and rapid tranquiliser chemical restraint over time.

NHS and independent sector inpatient services, and the case of the missing information
Information from the MHSDS about restraints used on people with learning disabilities and autistic people can be broken down by whether the inpatient service is an NHS or independent sector. The two graphs below show the number of people subject to at least one restrictive intervention and the total number of restrictive interventions people are subject to, broken down by NHS vs independent sector provider.
Both graphs seem to show a similar picture. For the number of people subject to at least one restrictive intervention, in NHS inpatient services there is a dip in the first peak of the COVID-19 pandemic then a steady increase ever since. In independent sector services there is the double spike in May and July 2020 I've mentioned already, interrupting a gradual decrease and flattening out over time of the number of people subject to restrictive interventions.
The picture in terms of the total number of restrictive interventions is similar - increasing over time in NHS inpatient services, and (except for the spikes) gradually decreasing over time in independent sector inpatient services.


Is this an accurate picture? The spikes in May and July 2020 (finally, he gets to the spikes!) give us a clue. In these two months, the Cygnet organisation (recorded in the MHSDS in May 2020 as having 360 autistic people and people with learning disabilities in inpatient units) recorded 830 and 775 restrictive interventions respectively. In June 2020, August 2020, and every month since, the number of restrictive interventions is recorded as an asterisk, meaning anything between 0 and 4 restrictive interventions in total for the month. These could mean a complete absence of reporting of restrictive interventions in inpatient services for the whole Cygnet organisation. Elysium (485 people in May 2020), Partnerships in Care (90 people) and Huntercombe (90 people) all report asterisk levels of restrictive interventions throughout the whole pandemic period - St Andrews is the only large (50+) independent sector organisation that reports data to the MHSDS every month on restrictive interventions in inpatient services.
So, the figures on restrictive interventions within independent sector inpatient services are likely to massively undercount the restraints that people are being subject to - even the two months of spikes will be undercounts as they are missing information from some big independent sector organisations.
Summary, and why data matters
So, what do I think the MHSDS information tells us about restraints in inpatient services throughout the COVID-19 pandemic (so far)? A few things:
- Overall, about 9% of people with learning disabilities and autistic people in inpatient services will be subject to an average of 10 restrictive interventions per person in any given month.
- Young adults aged 18-24 are most likely to be subject to restrictive interventions.
- Children and young adults up to 18 years old are moat likely to be subject to multiple restraints.
- Even taking the incompleteness of reporting into account, there is a possible trend towards the increasing use of restrictive interventions over the course of the pandemic.
- Standing, supine, seated and 'other' physical restraints are most commonly reported (at least 150 people are subject to each of these types of physical restraint every month).
- Around 100 people every month are subject to prone restraint.
- An increasing number of physical restraints are being recorded as 'other'.
- Seclusion, oral chemical restraint and rapid tranquilisers are most commonly reported, and possibly increasing over the time period of the pandemic.
Why does data matter?
Accountability - self-advocacy groups are getting together and wanting to use information like this to hold local inpatient services to account. Please take a look at this open letter from My Life My Choice, Sunderland People First, Speak Up, and Sheffield Voices - you can sign it electronically.
Visibility - although the MHSDS has been collecting restraints information for some time, it was only made routinely publicly available after a File on 4 programme reported on restraints information gained through a bitterly contested Freedom of Information process. Without this visibility, any form of scrutiny is much more difficult.
Proactive regulation - CQC inspections of inpatient services are more frequently rating services as Inadequate, only using information on restraints that do not seem to be reported to the MHSDS (see this recent CQC inspection report on Cygnet Views Matlock). If MHSDS data were complete and regularly reported, inspections could be more proactive rather than reactive.
The political uses of data. We need completeness of data collection for a level playing field between organisations that comprehensively report restrictive interventions vs those who don't. I really don't understand how major companies can just not report supposedly mandatory data for months and years on end, with seemingly no consequences.
Policy. It's an obvious point, but if there are national policy ambitions to reduce the use of restraints, you need to have a reasonably complete picture of what people are being subjected to.
That's more than enough - words, graphs, and utter grimness of people's lives in the abstracted form of numbers.
No comments:
Post a Comment
Note: only a member of this blog may post a comment.