"Happiness is the target one only has to aim at in order to miss" John Cooper Clarke
There are myriad ways to bring to light the abject failure of governments and services to make good on their promises after the Panorama programme on Winterbourne View, over 12 years ago in 2011. The most important are direct accounts of people's experiences in these places, and how life can be so different with decent support. A small way to add to the picture is to examine, on the government's own terms, whether they are achieving what they say they've set out to do, most obviously in terms of the number of people still in inpatient units.
To keep this blogpost relatively short I won't go over again what has happened, and more especially what has failed to happen, since the Winterbourne View programme first aired. I will just focus on a set of targets that the government has set about the maximum number of children and adults there should be in inpatient units, by the end of March 2024. With less than a year to go until this deadline, how close is the government to meeting the targets they've set?
The Building the Right Support for People with a Learning Disability and Autistic People Action Plan (2022) restates the NHS Long Term Plan target that “by March 2024 mental health inpatient provision for people with a learning disability and autistic people will reduce to less than half of 2015 levels (on a like for like basis and taking into account population growth). This means that for every 1 million adults, no more than 30 people with a learning disability and autistic people will be cared for in an inpatient unit. For children and young people, no more than 12 to 15 autistic children and young people and children and young people with a learning disability per 1 million children, will be cared for in an inpatient unit.”
So, these targets (themselves a watering down of targets set in the original Building the Right Support in 2015, and puny in comparison to the aims of the government immediately after Winterbourne View) are expressed in a relatively straightforward way. What's actually happening?
Targets for
children
The first graph below shows the number of children (aged less than 18 years) in inpatient units over time, from March 2015 to March 2023 for AT data, and from March 2018 to March 2022 for MHSDS data.
Without going over this again at great length, AT stands for Assuring Transformation, a set of data collected by health service commissioners and reported every month, which tends to focus on people with learning disabilities and autistic people in 'specialist' inpatient units. MHSDS stands for the Mental Health Services DataSet, which is collected in real time by mental health service providers and reported monthly, which additionally to AT tends to include people with learning and autistic people in mainstream mental health inpatient units. Unfortunately, according to NHS Digital (now being absorbed into NHS England), many mental health service providers have been subjected to a 'recent' cyber attack, meaning that there has been no national MHSDS information since July 2022. You can find all this information here.
Number of children (aged less than 18 years) with learning disabilities and autistic children in inpatient services in England

The second graph below shows the rates per million population (aged less
than 18 years) of children with learning disabilities and autistic children in
inpatient services. ONS mid-year population estimates were used from 2015-2020
– more recent population estimates were calculated by applying the annual population growth
rate from 2015 to 2020.
Rate per million children population of children with learning disabilities and autistic children in inpatient services – England

The first graph shows that according to the AT dataset, 170 children in March 2015 (when the BtRS Action Plan states that the number of children in inpatient services were undercounted) through to 240 children in March 2023 were in inpatient services. There is no clear trend over time, certainly not of reducing numbers of children in inpatient services. The second graph shows that in March 2023 the rate per million of children in inpatient services was 19.4, above the target for 2023/24 of 12-15. On current population figures, the number of children in inpatient services needs to reduce to around 185 children to be within the upper target band and under 150 children to be within the lower target band.
Targets for adults
Number of adults (aged 18+ years) with learning
disabilities and autistic children in inpatient services in England

The fourth and final graph below shows the rates per million population (aged 18+ years) of adults with learning disabilities and autistic adults in inpatient services.
Rate per million adult population of adults
with learning disabilities and autistic adults in inpatient services – England
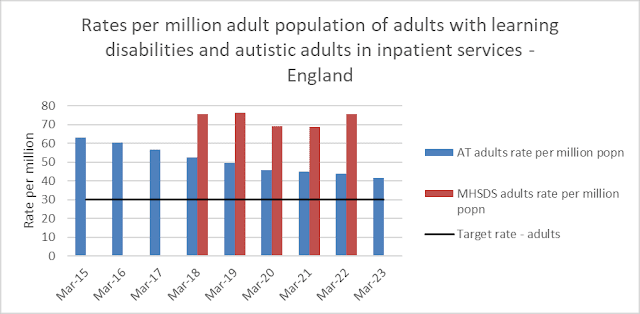
The third graph shows that, according to the AT dataset, 2,735 adults in March 2015 through to 1,890 adults in March 2023 were in inpatient services (although as the March 2023 data is relatively recent it is likely to be a slight underestimate). There is a downward trend over time, at an average compound rate of a 4.5% reduction per year. The fourth graph shows that in March 2023 the rate per million of adults in inpatient services was 41.7, above the target for 2023/24 of 30. On current population figures, the number of adults in inpatient services needs to reduce to 1,360 adults to be within the target band.
Applying the average reduction of 4.5% a year to the 1,890 adults in inpatient units in March 2023, it would take seven years (to March 2030) to reach the Building the Right Support target of 30 per million for March 2024. The downward trend has slowed over time: it was faster for 2015-19 (average compound rate -5.6% per year) than for 2019-2023 (average compound rate -3.6% per year). Applying the more recent -3.6% rate, it would take nine years (to March 2032) to reach the target for March 2024.
The MHSDS reports higher numbers of adults in inpatient services than AT, with 3,395 adults with learning disabilities and autistic adults reported to be in inpatient services at the end of March 2022. There is no clear trend in numbers over time according to the MHSDS, with lower numbers in March 2020 and March 2021 likely to be related to the COVID-19 pandemic. The rate per million of adults in inpatient services according to the MHSDS was 75.4 in March 2022, very similar to the 75.6 reported in March 2018, compared to the Building the Right Support target of 30 per million. Because there is no existing downward trend over time, there is no future date at which the target rate would be met.
Even on the progressively less demanding terms that the government has set for itself, this is abject failure.
No comments:
Post a Comment
Note: only a member of this blog may post a comment.