Monday, 6 July 2020

What can the statistics tell us about people with learning disabilities and/or autistic people in inpatient units during COVID-19? Part 1 - number of people

Summary

This blogpost is about the number of autistic people and/or people with learning disabilities in inpatient units (including ATUs) during the COVID-19 pandemic.

The number of people in inpatient units run by private companies did not change much during the first wave of the COVID-19 pandemic.

The number of people in inpatient units run by the NHS dropped as the first wave of COVID-19 hit. These are likely to be people who were staying in general mental health inpatient units for a few days or weeks.

The biggest drops in the number of people in inpatient units were in young people (aged under 25 years) and people who had not been sectioned under the Mental Health Act.


This blogpost updates and adds more detail to a previous blogpost asking whether regular statistics could tell us anything useful about what was happening to people with learning disabilities and autistic people as the first wave of COVID-19 hit from March 2020 onwards. This is the first of three linked blogposts. Part 1 (this post) will focus on what the statistics show about the number of people in inpatient units as the first peak of the COVID-19 pandemic hit. Part 2 will focus on how many people were admitted to these units, how many people left these units, and how many people in these units died. Part 3 will focus on what the statistics say about restrictive interventions used on people in inpatient units leading up to the start of the pandemic.

In this blogpost, we have information from NHS Digital from two databases. One of them is Assuring Transformation (AT), which is reported monthly from health service commissioners and concerns what NHS England/Improvement (I will use NHSEI from now on) consider to be the ‘core business’ of Transforming Care – people in specialist inpatient services for people with learning disabilities and autistic people where the unachieved policy aim for at least 8 years has been to drastically reduce the number of people in these units. In this post I will report information from AT up to the end of May 2020, although as commissioners can report retrospectively very recent figures always underestimate the number of people in these units.

The second database is the Mental Health Services Dataset (MHSDS), which is reported monthly from mental health service providers – this records all people flagged across all mental health inpatient services as a person with learning disabilities or an autistic person. This database takes longer to analyse, so information using the MHSDS is only available up until the end of March 2020.

The question I want to ask in this blogpost is as follows: As the first peak of the COVID-19 pandemic hit in March 2020, were there any changes to how many people with learning disabilities and/or autistic people were in inpatient units?

The first graph below shows the number of autistic people and/or people with learning disabilities (just switching things around so hopefully no-one feels like they’re always the and/or) in inpatient units.


The purple lines with triangles are the number of people recorded by the AT dataset in inpatient units, from January 2020 to May 2020. There are two purple lines here, although they are pretty close together. The light purple line is a snapshot of the number of people in inpatient units at the end of each month (these are the figures that NHSEI like to use). The darker purple line is the number of people who have been in inpatient units at any time during the month (so it could be people who left inpatient services at some point in the month, or people who were in and out of an inpatient unit in the same month).

Bearing in mind that in AT data recent months are always underestimates, overall there might be a slight downward trend in March and April (from 2,170 people at the end of February to 2,045 people at the end of April) but the number of people may be creeping back up in May (2,060 people at the end of May). Because the light and dark purple lines are pretty similar,  the AT data also suggest that the population of people in inpatient units is pretty stable, with relatively few people moving in and out of these units for very short periods of time.

In the same graph, the red lines with circles are from the MHSDS. They are only up to the end of March 2020, but they show a completely different picture to the AT dataset. The light red line is the snapshot of the number of people with learning disabilities and/or autistic people in inpatient units (including both ‘specialist’ and general mental health units) at the end of each month. The darker red line is the number of people spending some time in an inpatient unit at some point during each month.

A few things.

First, the number of autistic people and/or people with learning disabilities in inpatient units recorded in the MHSDS is much higher than the number of people recorded in AT. This is mainly because the MHSDS records people with learning disabilities and/or autistic people in a much wider range of mental health inpatient services such as adult and older people’s mental health inpatient units than the mainly ‘specialist’ learning disability inpatient services covered by AT. For example, at the end of January the MHSDS recorded 3,810 people in inpatient units at the end of the month compared to the 2,185 people recorded by AT.

Second, in the MHSDS dataset there is a big difference in the number of autistic people and/or people with learning disabilities in inpatient units at the end of each month versus the number of people spending some time in inpatient units during each month. This is mainly because the MHSDS records a lot of people spending very short periods of time in inpatient units. For example, during January 2020 the MHSDS recorded 1,050 episodes of people with learning disabilities and/or autistic people going in and out of inpatient units within the same calendar month, so they would not be picked up in any end of month ‘snapshot’ figures (the AT dataset records 10 people). The MHSDS also reports that there were 575 episodes of people spending some time in inpatient units in January 2020 for the purposes of ‘respite’ (the AT dataset records 45 episodes).

Third, the MHSDS dataset records big drops in the number of autistic people and/or people with learning disabilities in inpatient units from January to March 2020. Looking at numbers of people in inpatient units at the end of each month, this dropped from 3,810 people at the end of January to 3,260 people at the end of March. Looking at the number of people spending any time in an inpatient unit during each month, this dropped from 5,430 people during January to 4,845 people during March. The AT dataset records much smaller decreases in this time period.

So, there are signs from the AT dataset of a small decrease and signs from the MHSDS dataset of a much bigger decrease in the overall number of people with learning disabilities and/or autistic people in inpatient units as the first peak of COVID-19 started to hit.

The next thing I looked at was whether these decreases were consistent across NHS and independent sector inpatient units. In making this comparison, it is important to remember that, for autistic people and/or people with learning disabilities, the kinds of inpatient services they spend time in are much more diverse in NHS services than in independent sector services. The graph below is from the MHSDS and breaks down, for each month January – March 2020, how many people across NHS and independent sector services were in different types of inpatient service. In independent sector services, most people are in a learning disability ward (although many other people are in adult mental health wards and some are in child and adolescent mental health wards). In NHS services, a minority of people are in learning disability wards, with more people in adult mental health wards and many people in a range of other types of ward.


Bearing this in mind, the graph below shows the number of people in inpatient services at the end of each month broken down by NHS vs independent sector provider. The AT dataset (the light purple line is NHS, the dark purple line is independent sector) shows a decrease in the number of people in NHS inpatient services from the end of February to the end of March 2020, with smaller changes either side of this. The AT dataset also shows that there was little change in the number of people in independent sector inpatient services throughout. The MHSDS dataset shows a much more pronounced decrease in the number of people in NHS inpatient services (the light red line) during March 2020. As for the number of people in independent sector services recorded by the MHSDS (the dark red line), there appears to be a drop during February 2020 but not from February to March. However, looking at the data in more detail, this is because two independent sector providers (Partnerships in Care with 200 people, and the Priory Group with 15 people) are included in the MHSDS at the end of January but disappear from the MHSDS altogether after that. If you add in these 215 people to February and March 2020 figures (the dotted dark red line) the number of people in independent sector inpatient services does not change from January to March 2020.


The continuing work of the Joint Parliamentary Committee on Human Rights on the detention of children and young people with learning disabilities and/or autistic children and young people highlights the importance of understanding what is happening to young people in inpatient units during the COVID-19 pandemic. The graph below shows how many people were in inpatient units at the end of each month (AT data are the purple lines, MHSDS data are the red lines), broken down into four age band: under 18 years; 18-24 years; 25-34 years; 35+ years. I chose these four age bands firstly not to clog up the graph too much, and secondly because for people 35 years old and upwards the patterns are very similar. What does the graph show? For each age band, the AT dataset seems to show pretty small decreases in the number of people in inpatient units, whereas the MHSDS dataset shows bigger decreases.


Because the number of people in different age bands varies so much, another way to look at this is to look at percentage change over time. The graph below looks at percentage change in numbers for each age band over time, taking the end of January 2020 as a baseline. The AT dataset (the purple lines again) show that the number of young people aged under 18 years (the lightest purple line) reduced by 19.1% up to the end of April 2020, although numbers were creeping up again by the end of May 2020. The number of young people aged 18-24 years in inpatient units had also decreased by 8.1% to the end of May 2020, while decreases were smaller for older age groups. The MHSDS dataset (the red lines again) shows a similar pattern, but magnified. The number of young people aged under 18 years in inpatient units (the orange line) dropped by 35.6% from January to March 2020, with decreases of 17.2% for people aged 18-24 years, 14.9% for people aged 25-34 years, and 10.3% for people aged 35 years plus.


The last thing I looked at for this blogpost was the legal status of autistic people and/or people with learning disabilities in inpatient units. The graph below shows, at the end of each month, how many people were in inpatient units broken down by legal status (informal – ie no section; Part II section; Part III section; and other section). The AT dataset (purple lines) show that the most common legal status for people in inpatient units are Part II and Part III sections, which seem to show little change over time. Informal legal status is less common in the AT dataset, but it does seem to show some decrease over time, and people on other types of section are quite rare. In the MHSDS, the number of people in inpatient units on Part III sections and other sections seems very similar to the AT dataset. However, the number of people with informal legal status is much, much higher than the number recorded in the AT dataset, and shows a sharp decrease from January to March 2020. The number of people with a Part II section recorded by the MHSDS is also much higher than the number of people recorded in the AT dataset, and shows a less dramatic but appreciable decrease from January to March 2020.


As with the information on age bands, I also looked at legal status in terms of percentage change over time (see the graph below). Bear in mind that the number of people with ‘other’ sections is very low, so small differences in number can look like big percentage changes over time, so the big percentage increase in people with other sections needs to be viewed sceptically. Aside from this, both the AT and MHSDS datasets show a consistent drop in the number of people with informal legal status in inpatient units over time (around a 30% drop). The MHSDS (also less so for the AT dataset) also reports a drop of 10.3% in the number of people with Part II sections in inpatient units from the end of January to the end of March 2020. There is little change in the number of people with Part III sections.


What does all this add up to? I think these statistics tell us the following things:

1) The mainly ‘specialist’ inpatient services covered by Assuring Transformation, particularly those in the independent sector, have shown little change in the number of people with learning disabilities and/or autistic people throughout the first peak of COVID-19.

2) There are many more people in inpatient services, often for very short periods of time (including for ‘respite’ purposes), than are reported by Assuring Transformation. These are more likely to be NHS general adult mental health inpatient services than ‘specialist’ learning disability services. The number of autistic people and/or people with learning disabilities in NHS adult mental health and learning disability inpatient services dropped sharply as COVID-19 began to hit, whereas the number of people in independent sector inpatient services showed little change over time.

3) The biggest decreases in numbers of people in inpatient units were among young people (aged under 18 and 18-24 years) and people with informal legal status (and, to an extent, Part II sections).

Obviously these statistics can’t tell us what happened to the people who would have been using these inpatient services, or why the numbers have dropped. We will also have to wait to see if these reduced numbers become ‘the new normal’, or if things return to how they were before COVID-19. In Part 2 of this blogpost trio I will look at how many people were admitted to these units, how many people left these units, and how many people in these units died


Thursday, 2 July 2020

COVID-19 deaths of people with learning disabilities in England: a quick update

Summary

  • This blogpost updates information on the number of people with learning disabilities in England who have died of COVID-19, up to 30th June 2020.
  • At least 620 people with learning disabilities have died of COVID-19 in England.
  • The number of people with learning disabilities dying of COVID-19 is now around 5 people every week. For two weeks in April it was over 100 people every week.
  • People with learning disabilities might still be more likely to die of COVID-19 than other people.

Because I haven't provided updates on the weekly information about the deaths of people with learning disabilities from COVID-19 since this long blogpost, this post is just a quick update of the numbers with little commentary. An excellent easyread summary of the information on COVID-19 deaths and people with learning disabilities has been produced by Bradford Talking Media (BTM). 

The graph below shows weekly information from the LeDeR programme, which is likely to be the best source of information we have on the deaths of people with learning disabilities in England (although it is unlikely to be complete). The red columns show the number of people who have died of suspected or confirmed COVID-19, and the blue columns show the number of people who have died of other causes. 

LeDeR reports that in 2020 up to 26th June, 620 people with learning disabilities have died of COVID-19, and 910 people have died of other causes. The number of people dying of COVID-19 has been running at 5-10 people per week (the numbers are rounded  to the nearest 5) for the last three weeks. The number of people dying of other causes has been running at 30-40 people per week for the last 5 weeks.


There is also weekly information on the confirmed COVID-19 deaths in hospitals of people flagged as a person with learning disabilities or an autistic person. In theory this database, unlike LeDeR data, includes autistic people without learning disabilities, but it only includes people who died in hospital and who were confirmed as having COVID-19. 

The graph below shows this information for the chunk of time 24th March-12th May (when the data were first made public), and then for every week after that up to 30th June 2020. This dataset reports that at least 512 people with learning disabilities and autistic people have died in hospital with confirmed COVID-19. For the last three weeks, this dataset has recorded 3 deaths per week of people with learning disabilities and/or autistic people. 


This dataset also reports the total number of people who have died confirmed COVID-19 deaths in hospital, where flagging information (is the person a person with learning disabilities, an autistic person, or not) exists. From 24th March to 12th May (around the peak of the pandemic), 2.5% of everyone dying in hospital of confirmed COVID-19 was a person flagged as a person with learning disabilities or an autistic person. I tried to argue in the long blogpost that this meant a COVID death rate 4 to 5 times higher for people with learning disabilities and autistic people compared to others. After the (first) peak of the pandemic, from 13th May to 30th June, this has dropped to 1.5%, which is still a death rate 2 to 3 times higher.

The last graph below is a bit experimental, trying to show the cumulative picture of COVID-19 and non COVID-19 deaths over time from the LeDeR and NHSE datasets. This is just a different way of showing the same information in the graphs above that some people might find useful.


Overall, it is a relief that the number of people with learning disabilities (and potentially some autistic people, although I'm not convinced how many autistic people without learning disabilities would be included in any of these figures) dying COVID-19 deaths (and to a lesser extent non COVID-19 deaths) has dropped substantially from the (first) peak of the pandemic. It does still look like COVID-19 death rates might be higher for people with learning disabilities than for other people.

This is no time for complacency, though, and part of preparing for any second COVID-19 wave urgently needs to include:

1) Regular, honest, accessible information produced by the government on these numbers and what they mean. Beyond a single press release, NHSE (which publishes the LeDeR data and the confirmed COVID-19 hospital data) has produced nothing at all to describe or explain this information and certainly nothing in easy read (which the CQC did do when discussing their data release). This would help people with learning disabilities and those around them understand and think through their options when it comes to risk and COVID-19.

 2) Some analysis of information they already have to help work out the circumstances in which people with learning disabilities are most at risk of dying from COVID-19. For both the LeDeR and NHSE hospital data, analysis by age band, sex and ethnicity should all be relatively straightforward. From the LeDeR data, an analysis of deaths by where people live (both regionally and also by what kind of place people were living in) is possible and urgently needed. From the NHSE hospital data, they could easily analyse how many people with learning disabilities and autistic people who died confirmed COVID-19 deaths had health conditions linked to higher COVID-19 risk (particularly diabetes, dementia, chronic kidney disease, chronic pulmonary disease and heart disease). 

It is beyond me why these analyses were not done and shared at least two months ago, in ways that people can use.


Tuesday, 2 June 2020

What we know (so far) about the deaths of people with learning disabilities in England during COVID-19


UPDATE: If you want easier to read information about the deaths of people with learning disabilities during COVID-19, please click here to go to a brilliant easier to read summary made by Bradford Talking Media.


This blogpost (written on 2nd June 2020) tries to sum up the main issues coming out of the information released so far on the deaths of people with learning disabilities during the first phase of the COVID-19 pandemic in England. So far, the information released about the deaths of people with learning disabilities has been minimal, grudging and it feels to me deliberately designed to be inaccessible to pretty much everybody (although the Care Quality Commission press release today does have an easy-read version). How are people with learning disabilities, family members, organisations supporting people, health services and organisations setting local and national policy supposed to make informed decisions about what to do?

Information about the deaths of people with learning disabilities is collected differently, started at different times, is updated (or not) at different times, is reported differently, and involves different groups of people using different criteria for deciding whether a person has died of COVID-19 related causes or not. Because of all these differences I think we will never know accurately the number of people with learning disabilities who have died COVID-19 related deaths during the pandemic. While the figures collected will include autistic people with learning disabilities, I suspect we will continue to have virtually zero information about the deaths of autistic people without learning disabilities, which is why in this blogpost I am generally writing about people with learning disabilities rather than people with learning disabilities and/or autistic people.

But, for people with learning disabilities in England at least, I think there is enough information now to draw some initial conclusions that are really important for action.

The table below summarises the three main sets of information we have so far about the deaths of people with learning disabilities in England during the COVID-19 pandemic. I don’t know of similar information being published for Scotland, Wales or Northern Ireland. I don’t propose to go into massive detail here about the similarities and differences between these three sets of information (nobody but nobody, wants that) but to use information from these and other sources to highlight some consistent and inescapable conclusions.


COVID-19 and other deaths in the general population

Before looking at the information about people with learning disabilities, it is important to understand deaths amongst the general population of England throughout the COVID-19 pandemic so far. The best source for this is the Office for National Statistics (ONS), which produces weekly information on deaths attributed to COVID-19 (both confirmed deaths via testing and suspected deaths) or attributed to other causes based on death certificates, so this covers everyone no matter where they lived or died.

The graph below shows the number of non-COVID-19 deaths (the blue columns) and the number of COVID-19 related deaths (the red columns) each week from the beginning of January 2020 to the week ending 22nd May 2020. There is also a dark blue line, which is the weekly average of all deaths at the same time of year in the 5 years before COVID (2015-2019).

There has been lots of analysis of this information, so there are just a few things I want to mention here that will be useful to bear in mind when we’re looking at the information for people with learning disabilities later. First, although they’re too small to be able to see on the graph, COVID-19 related deaths (the red columns) start to be recorded in the week ending 13th March. The number of people dying COVID-19 related deaths rises really quickly to a peak in the weeks ending 17th and 24th April and is now declining, although the decline is not as rapid as the increase was in April. Second, looking at the deaths not attributed to COVID-19 (the blue columns), these also in absolute terms increase at the same time as the number of COVID-19 deaths was peaking. This could be because some COVID-19 related deaths were not recorded as such on death certificates (for a whole host of reasons), and/or because more people were dying of other causes because they weren’t accessing typical health services or those health services were not available as the NHS geared up for COVID-19. This is where the dark blue line of the average number of deaths in the 5 previous (non-COVID) years is really helpful – it shows us that at the first peak of the pandemic, more people were dying of non-COVID attributed causes than usual for the time of year (these deaths are often called ‘excess’ deaths, which is why some analysts prefer to look at the total number of deaths in a pandemic to judge the broad effect of a pandemic on people’s health).


COVID-19 and others deaths of people with learning disabilities in England – the LeDeR programme

The nearest equivalent to the ONS data for people with learning disabilities is the LeDeR programme. This started asking about COVID-19 deaths on 16th March 2020, relatively early on in the pandemic in England, it records both confirmed and suspected COVID-19 deaths, and people who live and die in any location can be recorded (although the LeDeR notification process is not mandatory).

The graph below shows weekly information on the COVID-19 related deaths (the red columns) and non-COVID-19 related deaths (the blue columns) for people with learning disabilities in England. [The first blue bar on the left of the graph looks very high because it is adding up all the deaths of people with learning disabilities notified to LeDeR from 1st January to 20th March 2020 – so 11 weeks’ worth of deaths rather than 1 week]. In total, since COVID-19 recording started up to 22nd May, 530 people with learning disabilities have been recorded as dying a COVID-19 related death (the red columns) and 680 people from the start of 2020 have been recorded as dying from another cause (the blue columns).

What does this graph show us? There are some similarities to the ONS data, in that the number of people with learning disabilities dying a COVID-19 related death rapidly increased to hit a peak slightly earlier than the general population in the weeks ending 10th and 17th April 2020, after which the numbers have been rapidly declining. Because we don’t have weekly information from the LeDeR programme on deaths due to non-COVID-19 causes before COVID-19 was starting to hit, it’s hard to tell if the number of non-COVID-19 attributed deaths (the blue columns) increased at the peak of the pandemic for people with learning disabilities as it did for the general population. However, the number of non-COVID deaths for people with learning disabilities was much lower for the week ending 22nd May than for the week ending 27th March, suggesting that even by 27th March the number of non-COVID-19 deaths might have been higher than usual.

In summary, the number of deaths of people with learning disabilities peaked at around the same time (mid-April) as deaths for the general population, with the biggest increases in deaths attributed to COVID-19 and potentially little change in the number of deaths not attributed to COVID-19.


‘Excess’ deaths and people with learning disabilities

Unfortunately, what we don’t have for the LeDeR data is the equivalent of the dark blue line in the ONS data – how many deaths have occurred at the same time of year in previous years - so we can look at whether there are more or fewer non-COVID-19 deaths during the pandemic compared to previous years. The LeDeR programme may be able to produce this information for 2019 but if so it has not been published yet.

In the absence of this, we have to speculate on the basis of scraps of information that we have. Extrapolating fairly wildly from death certificate information collected in 2016-2019 from about half of GP practices in England would suggest that, averaged out over non-COVID years, around 54 people with learning disabilities die every week. Looking at the LeDeR graph, this would suggest that there may not be huge numbers of ‘excess’ deaths of people with learning disabilities from non-COVID causes during the pandemic compared to previous years.

The information released today by the CQC tells a similar story. Of the 386 deaths of people with learning disabilities reported in the 5 weeks from 10th April to 15th May 2020, 180 of these were not attributed to COVID-19 – this is not much different from the 165 deaths of people with learning disabilities in the same places recorded for the same 5 weeks in 2019.

However, it is crucial to remember that people with learning disabilities are in any year much more likely to die at much younger ages due to avoidable causes compared to other people – for people with learning disabilities, every year is a year of ‘excess’ deaths. Indeed, the same death certificate information I’ve just mentioned reported that people with learning disabilities in 2016-2019 were around 4 times more likely to die than people without learning disabilities of the same age and sex.

In summary, while the level of non-COVID-19 deaths may not be that different as the pandemic peaks to previous years for people with learning disabilities (which is a different pattern to the general population), the ‘baseline’ level of deaths for people with learning disabilities is already much higher than the general population.

People with learning disabilities are at disproportionate risk of COVID-19 as the pandemic peaks

One startling difference between the data for the general population and the data for people with learning disabilities is the proportion of people’s deaths attributed to COVID-19. In the general population, even at the (first) peak of the pandemic less than 40% of weekly deaths were attributed to COVID-19. For people with learning disabilities, approaching 70% of people’s deaths were attributed to COVID-19 around the peak of the pandemic. Even taking into account any speculative potential differences in how people’s deaths were recorded, this strongly points to people with learning disabilities being more severely (fatally) impacted by COVID-19 when pandemics reach a peak.

The information released by the CQC backs up the LeDeR data (although the CQC COVID-19 data only started being collected when the pandemic was hitting its peak). Over the 5 weeks 10th April to 15th May 2020, 206 out of 386 deaths of people with learning disabilities were suspected or confirmed COVID-deaths, over half (53%) of all deaths in that time. A very recent study from The Netherlands found a similar pattern of people with learning disabilities being more severely affected (in terms of deaths) than the general population during a flu epidemic.

The information from NHS England on the confirmed COVID-19 deaths of people with learning disabilities and/or autistic people in hospitals in England also points to a similar conclusion. As of 26th May 2020 (with people only starting to be flagged on 24th March 2020, when the pandemic was already under way), NHS England reported a total of 477 people with learning disabilities and/or autistic people had died in hospital of confirmed COVID-19 compared to 19,496 deaths for everyone else (I have not included in this analysis the 6,554 people who were not flagged either way). This means that over this time period 2.4% of all confirmed COVID-19 deaths in hospitals were people with learning disabilities. In their initial press release, NHS England tried to claim that this figure was roughly equivalent to the proportion of people with learning disabilities and autistic people combined in the population as a whole. I think this is misleading. While careful prevalence studies might get you to that sort of percentage, health professionals flagging people in health systems are much more likely to be using GP registers of people with learning disabilities (there is no equivalent register for autistic people). At the end of March 2019, these registers were reporting that 0.5% of the population in most adult age brackets were people with learning disabilities. This would suggest that people with learning disabilities were 4-5 times more likely to die of confirmed COVID-19 in hospitals than other people.

And, like the LeDeR data and the Dutch flu data, this might be even worse at the point when a pandemic peaks. Although NHS England didn’t break down their initial information week by week they have done so since. For the two weeks up to 26th May, when the pandemic was past its initial peak, 1.5% of all confirmed COVID-19 deaths were people with learning disabilities (still 3 times the death rate of other people), compared to 2.5% of all confirmed COVID-19 deaths in the 8 weeks up to 12th May.

In summary, people with learning disabilities are disproportionately likely to die a COVID-19 related death than other people, and this difference is biggest when a pandemic reaches a peak.

Age of death and people with learning disabilities

The CQC data for the first time provides a breakdown on COVID-19 and non-COVID-19 deaths by broad age band for people with learning disabilities (this is for people living in residential care or using community-based social care). This breaks down the number of deaths of people with learning disabilities in the 5-week period 10th April – 15th May by age bands. Their graph of this information is copied below. The purple column on the left of each age band is the total number of deaths that occurred in this time period in 2019 for comparison purposes. In the blue stacked columns, the darker blue part of the column is 2020 deaths not attributed to COVID-19, and the lighter blue part of the column is 2020 deaths attributed to COVID-19. It should be said that the other data sources could easily provide this breakdown as well, but as yet nothing has been made public.

I think this graph shows some important findings. First of all, even in 2019 the peak age of death for people with learning disabilities using these types of social care was 55-64 years. Although the number of non-COVID deaths in 2020 was similar overall to the same period in 2019, there do seem to be ‘excess’ non-COVID-19 deaths among the 55-64 age group. And although it’s hard to see in this graph format, I think the number of COVID-19 deaths amongst people with learning disabilities is really substantial from relatively early in adulthood.


This pattern of deaths by age band is completely different to the general population. In the general population in England and Wales, 42% of people dying of COVID-19 were aged 85 years or more, another 32% were aged 75-84 years, and another 15% were aged 65-74 years. It is clear that people with learning disabilities are dying of COVID-19 at much younger ages than the general population (a new journal article from the USA reports similar findings).

Remember earlier on, when I suggested that people with learning disabilities were dying COVID-19 related deaths at substantially higher rates than other people, particularly when pandemics are at their peak? This age band analysis means that the figures I talked about earlier actually under-estimate how much more likely people with learning disabilities are to die of COVID-19 than other people. People with learning disabilities generally die 15-20 years earlier than other people, so bluntly speaking fewer people make it to the ages that are the highest risk for COVID-19 death among the general population (although some older people with learning disabilities, if they are living in mainstream residential care for older people, may not be identified as a person with learning disabilities). This, coupled with the increased health problems that people with learning disabilities have at earlier ages than other people (largely due to socio-economic inequalities and discrimination people experience from a very early age), mean that the risk of dying from COVID-19 must be even higher for working age adults with learning disabilities compared to the general population.

In summary, substantial numbers of working age adults with learning disabilities are dying COVID-19 related deaths, and are almost certainly at much higher risk of COVID-19 related deaths than the general population.

What we still don’t know

Although there is much more information than there was, there is so much important information that has yet to be analysed or released.

For example, we know virtually nothing about the staples of analysis for pretty much every group – what is the risk of death (both COVID-19 related and non-COVID-19 related) by age, sex or ethnicity for example? This should be easy to do with the LeDeR, NHS England and CQC datasets.

We could know much more about how COVID-19 and other deaths occur over time, particularly to help with reconciling different sources of information about the deaths of people with learning disabilities.

We know nothing about how the health conditions which we know are associated with risk of COVID-19 related deaths (for example diabetes, obesity, various respiratory conditions and several others) are associated with risk of COVID-19 and non-COVID deaths amongst people with learning disabilities. Are there particular health conditions that are particularly risky for people with learning disabilities? The existing NHS England dataset on people dying in hospitals already has the information to do an interim analysis of this.

We still know very little about potential differences in risk of death according to where people with learning disabilities were living before they died. The CQC data reports that, of the 386 deaths of people with learning disabilities in total in their dataset, 195 of these were people who had been living in residential social care. This is 39% of all deaths of people with learning disabilities in those 5 weeks (using data from the LeDeR programme), when according to NHS Digital social care statistics only 21% of adults with learning disabilities getting long-term social care (let alone all those who aren’t eligible) are in residential or nursing homes.

This translates to a death rate of 6.3 people with learning disabilities per 1,000 people with learning disabilities living in residential care in the 5 weeks 10th April – 15th May, or an annual death rate of 65.6 people per 1,000. This is a death rate approximately 4 times higher than the 17.7 people with learning disabilities per 1,000 people with learning disabilities living in care homes reported in newly published pre-COVID research across England and Wales. We know nothing about whether the risks of death are different for people with learning disabilities living with their families, in supported living, living independently, or living in care homes. We know nothing about the deaths of people with learning disabilities currently in specialist inpatient units, beyond the NHS Digital Assuring Transformation dataset reporting for the first time ever at least 5 deaths of people with learning disabilities and/or autistic people in specialist inpatient units in the month of April 2020.

We know nothing about the deaths of autistic people without learning disabilities.

There has been very little effort to make any of this information accessible.

What does it all mean?

This blogpost is extremely long because I wanted to show my working out so people can evaluate whether it makes sense or not. The conclusions are really straightforward:

1) People with learning disabilities are at much greater risk of death from COVID-19 than the general population, particularly at times when pandemics are at their peak. Whether during a pandemic or not, people with learning disabilities are at much greater risk of dying from other causes than other people.

2) People with learning disabilities are likely to be at much, much greater risk throughout adulthood, rather than COVID-19 risk being a function of (older) age.

3) Like we have risk factors for the general population, we urgently, urgently need to know what the risk factors are for people with learning disabilities. This could be age, sex, ethnicity, what kinds of places people are living, deprivation and hardship, particular health conditions or combinations of health conditions, how much support people need and so on. Almost all of this analysis could be done with information that already exists.

4) It is important that as well as focusing on COVID-19 deaths amongst people with learning disabilities, we also remember to focus on other causes of death, where even without a pandemic people with learning disabilities are likely to die much younger than other people. Preventive health services like annual health checks, flu vaccinations and postural care are just as essential now as they were 6 months ago, and stopping these and other health services, along with the likelihood of life in lockdown being less mentally and physically healthy for people, might see an increase in non-COVID-19 deaths over time even if COVID-19 deaths do not reach another peak.

5) Disabled people, including people with learning disabilities, continue to be completely invisible throughout COVID-19. Public Health England today published a "COVID-19 review of disparities in risks and outcomes" - no mention of disabled people at all. Audit data from intensive/critical care shows that needing assistance with daily living is one of the biggest risks for dying within 30 days of entering critical care, even taking all the other risk factors into account, and no-one seems concerned about this. Information is put out with no attempt to produce easy-read versions or to bring people with learning disabilities into this crucial conversation. I oscillate between contained seething, occasional rage and more frequent despair about this. 

Jonathan Senker of Voiceability has written an excellent blogpost on what needs to be done, now, to ensure people with learning disabilities are not disproportionately hit by any second wave of COVID-19 infection like they were the first time. I highly recommend that you read this (much, much shorter) blogpost – there are 9 headlines:

1. Ensure existing guidance on equal access to quality healthcare is followed

2. Gather reliable information and take action based on it

3. Provide personal protective equipment

4. Provide coronavirus tests

5. Take action to protect people moving into and between care settings

6. Reduce staff mobility

7. Consider if people will be safer in other settings

8. Review what is in the best interests of people subject to deprivation of liberty

9. Involve people in decisions that affect them


If you have reached this far, you have suffered enough. I will stop there.


Saturday, 30 May 2020

What happens to people with 'dependency' in COVID-19 critical care? A look at the ICNARC audit report


There have been consistent worries and reports about potential discrimination against disabled people who contract COVID-19, both in terms of access to critical care in hospitals and in terms of equal treatment once in critical care. As far as I know, there hasn’t been much focus on whether there is evidence to evaluate the presence or potential extent of such discrimination.

One (far from ideal) way to look at this is by looking at the comprehensive (but inaccessible in terms of easy-read) weekly audit reports being produced by the Intensive Care National Audit and Research Centre (ICNARC). ICNARC collects and analyses information about people in intensive/critical care with confirmed COVID-19 from 289 critical care units across England, Wales and Northern Ireland. These weekly audit reports (the information I will refer to here comes from their report of 29th May 2020, with information on people up to 28th May) cover in great detail information about who is admitted to critical care with confirmed COVID-19, what treatment they receive, and outcomes (in terms of whether people died in critical care or were discharged alive, and for some measures 30-day survival after admission).

One of the indicators they report on is ‘dependency prior to admission to acute hospital’. ‘Dependency’ (this measure is not defined) is recorded at three levels:

  • ·        Able to live without assistance in daily activities
  • ·        Some assistance with daily activities
  • ·        Total assistance with all daily activities

Although it is unclear who decides which category to place people into, and on what criteria (is it some kind of frailty assessment, as NICE recommends?), it is the nearest thing I know of to an indicator of need for support for activities of daily living in these kinds of audits. This blogpost will simply look at some comparisons between people not requiring support vs people requiring support, in terms of admission to critical care, access to health interventions once in critical care, and outcomes of critical care.

Admission to critical care

Up to 28th May 2020, the audit reports information on 9,034 people admitted to critical care where there is information on ‘dependency’ (I’m going to call this ‘need for assistance’ from now on). Of these 9,034 people, 8,201 (90.8%) were people with no need for assistance, 802 (8.9%) were people with some need for assistance, and 31 (0.3%) were people with a need for total assistance. The graph shows these percentages, compared to the percentage of people needing assistance admitted to critical care for non-COVID viral pneumonia from 2017-2019.

This graph shows that a smaller proportion of people with COVID-19 admitted to critical care had a need for assistance compared to people in the previous three years with non-COVID viral pneumonia. There are multiple potential explanations to account for this difference (COVID-19 might result in more serious health consequences for a wider range of people across a wider age range than non-COVID viral pneumonia, for example), but there is clearly a difference here.


Treatment for people in critical care

Once people are admitted to critical care, what kinds of treatment do people get? The ICNARC audit focuses on advanced vs basic respiratory support and the presence or not of renal (kidney) support.

The graph below shows the proportion of people not needing assistance getting advanced vs basic respiratory support, compared to the proportion of people needing assistance getting advanced vs basic respiratory support. As the graph shows, 75.7% of people not needing assistance received advanced respiratory support, compared to 57.8% of people needing assistance for daily living.


There was a similar difference in people getting renal support. As the graph below shows, 26.0% of people not needing assistance received renal support compared to 19.2% of people needing assistance.


Outcomes of critical care

The ICNARC audit records whether people with confirmed COVID-19 who had been in critical care either died in critical care or were discharged from critical care alive. Of course, it is possible that people discharged from critical care could die at a later point, and it is important to note that people who stay in critical care for long periods of time are less likely to be recorded in these figures (because they are still in critical care).

The graph below shows that for people not needing assistance, 57.8% of people were discharged alive from critical care. For people needing assistance, 48.3% of people were discharged alive from critical care.


So far, we have seen that people not needing assistance were more likely to receive advanced respiratory support and/or renal support, and more likely to be discharged alive from critical care. Can we disentangle this a little to understand more about what is happening to people? One thing the ICNARC report allows us to do is to look at these outcomes separately for people who did and didn’t receive advanced respiratory and/or renal support.

So, the graph below reports the same outcomes as the graph above, but just for those people who had received advanced respiratory support while in critical care. Of those who had received advanced respiratory support, 48.2% of people not needing assistance were discharged alive, compared to 38.9% of people needing assistance.


And what about those people who did not get advanced respiratory support and only received basic respiratory support in critical care? The graph below shows this information. For people not needing assistance, the vast majority of people (84.9%) getting only basic respiratory support were discharged alive from critical care. This suggests that, for people not needing assistance, people with a more serious COVID-19 condition in critical care received advanced respiratory support.

For people needing assistance, a much lower proportion of people getting only basic respiratory support (56.2%) were discharged alive from critical care. It is unclear why there is this very substantial difference between people with and without a need for assistance.


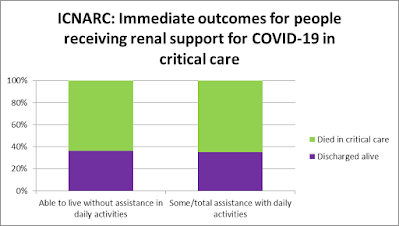
There is a similar, if less extreme, pattern for people who got or didn’t get renal support, as the two graphs below show.  Among those getting renal support, the proportion of people being discharged alive was very similar for people not needing assistance (36.4%) and people needing assistance (35.2%).  Among those not getting renal support, a greater proportion of people not needing assistance were discharged alive (65.3%) compared to people needing assistance (51.3%).


There are clear differences between people needing assistance in daily living and people not needing assistance in daily living when it comes to critical care and COVID-19, according to the ICNARC indicator of ‘dependency’. There are potential differences in access to critical care, differences in access to advanced respiratory support and/or renal support, and differences in outcomes, particularly amongst those people not receiving advanced respiratory support and/or renal support. There are multiple potential explanations for these differences, one of which may be that people needing assistance with daily activities are more likely to be in high-risk groups (for example on grounds of age or health conditions associated with greater risk of a severe reaction to COVID-19). Towards the end of the ICNARC report, the authors report a very useful set of analyses investigating the risk of death within 30 days of entering critical care associated with various factors (e.g. age, ethnicity, area deprivation, body mass index, ‘dependency’) taking all the other factors into account (e.g. the fact that people needing assistance with daily living also tend to be older).

Although as yet only graphs are provided rather than tables of figures, it looks like, for people with confirmed COVID-19 in critical care, if you need assistance with daily living you are somewhere between 1.5 and 2 times more likely to die within 30 days of entering critical care compared to someone who does not need assistance with daily living. This is taking into account age and other risk factors such as obesity. This degree of risk, with the huge exception of age, is as great or greater than any of the other factors investigated in the report (sex, ethnicity, area deprivation, body mass index, immunocompromised, sedated for first 24 hours in critical care).

For all the big differences in access, treatment and outcomes for people needing assistance with daily living that I’ve pulled out of this excellent audit report, I’m not hearing the clamour for rapid reviews, inquiries or action that have rightly been raised when other dimensions of disadvantage have been revealed. Another, material difference as we face the second spike.


Monday, 4 May 2020

A dereliction of death duty

So far in this pandemic (where I suspect we are only at the beginning), in my blogs and social media I have tried to be measured and constructive, trying to provide useful information and analysis and indicate what is possible in terms of types of information urgently needed about people with learning disabilities, autistic people, and disabled people more generally.

So far, we have seen published information and analyses of deaths related to COVID-19 (and often, crucially, all-cause mortality) in England by: age; sex; ethnicity; area deprivation; location; 'dependency'; location of death; care homes (and this is only what comes to mind right now). All of these issues (some of them after some pushing by the media) have been picked up as crucial for understanding potential inequalities, and are triggering rapid reviews and research, and influencing policy and practice.

Meanwhile, published information about COVID-19 and people with learning disabilities, or autistic people, remains (as far as I know) precisely zero. Absolutely nothing. Right from the start of the pandemic, many people have been pushing for information about COVID-19 infections, testing and deaths (both COVID-19 related and of any apparent cause) to be released concerning people with learning disabilities and autistic people. The response from NHS England/Improvement has been a complete brick wall, even it seems to many of their own staff (someone within NHSE/I contacted me recently to ask if I knew of any statistics concerning deaths amongst people with learning disabilities).

And then there was this tweet from Rebecca Thomas at HSJ, who has assiduously been asking questions of NHSE/I for months.


Yes, that does say NEXT YEAR. 2021. Remember, the publication of the first LeDeR report two years ago today (4th May) was the occasion of a huge row, as NHSE/I delayed its publication by several months, published it on the day of local election results, and then tried to claim it had nothing to do with the publication date. 

Before I get to what organisations could do, within 24 hours, to publish information about infection rates and deaths amongst people with learning disabilities (and, for some things, autistic people), here are some urgent questions about the LeDeR programme.

  • What will be the publication date of the 2021 LeDeR report containing the information on COVID-19 deaths amongst people with learning disabilities? No-one knows (by no-one I am referring to the public, including people with learning disabilities and autistic people, as we are clearly the nobodies here).
  • What is the future of the LeDeR programme? No-one knows.
  • The current contract finishes at the end of May (yes, in 25 days' time) - will there be an extension to the LeDeR contract? No-one knows. 
  • Will a contract be signed with an organisation other than the University of Bristol to continue the LeDeR programme, and how can effective handover be expected to happen in this timescale? No-one knows.
  • LeDeR reviews done by NHS Trusts are currently suspended, judged inessential during the COVID-19 pandemic - will they ever resume? No-one knows.
  • Notifications of deaths are still being made to the LeDeR programme (the basis for the secret reporting on deaths) - if there is no contract beyond the end of May, will these notifications just stop being recorded? No-one knows.
  • The LeDeR programme is set up as a 'health improvement' programme (through quangoid HQIP) rather than a research programme, so what happens to all the data from the LeDeR programme - does it have to be destroyed under the terms of the contract? No-one knows.

That NHSE/I is not being straight with the public about any of these questions should be a national scandal.


So - these are things that NHSE/I in particular, and also CQC, could do WITHIN 24 HOURS, to publish information about the impact of COVID-19 on the lives of people with learning disabilities and (sometimes) autistic people.


What NHSE/I can do NOW

1)      NHSE/I have weekly summaries of notifications of deaths to the LeDeR programme, hopefully including both COVID and deaths from any recorded cause (LeDeR notifications collect this information). Publish it NOW.

2)      NHSE/I have told Rebecca Thomas that their reporting of COVID deaths of people in acute hospitals can be broken down by learning disabilities and other 'underlying conditions' (it's a scandal in itself that NHSE/I is saying learning disabilities, or autism, are 'underlying conditions' - showing a revealing lack of understanding). These analyses could start now, and be reported for the whole period retrospectively. Maybe they've been done already and not released? No-one knows.

3)      NHS Digital collect information for NHSE/I on people with learning disabilities and autistic people in specialist and mainstream mental health inpatient units. As yet, I have seen no public data on COVID-19 infections or deaths amongst anyone at all in mental health inpatient services in England. The data are collected continuously and reported on for people with learning disabilities and autistic people monthly:
a.  Commissioners are regularly reporting all sorts of information (including the number of deaths) for the Assuring Transformation dataset. Weekly reports of the total number of people dying in these specialist units can be produced NOW – the proforma that commissioners complete could also be amended to ask for more detail on deaths. At the moment we are hearing about people dying in inpatient units from the local press, rather from the national organisation allegedly responsible for people in these places.
b.  NHS Digital uses the MHSDS (data provided by service providers on all mental health inpatient units) to extract information on people with learning disabilities and autistic people in both specialist and mainstream mental health inpatient units. Could this dataset be used to provide some timely information on the deaths of autistic people and people with learning disabilities in mainstream mental health inpatient units as well as specialist units?


What the CQC can do NOW
The CQC started a little late, but in the notifications of deaths that are required to be sent to them (both in relation to registered social care services, and separately in relation to be detained under the Mental Health Act) they now require information on suspected COVID-19 deaths as well as causes of death recorded on death certificates. This information is now being collated and analysed nationally, with data on care homes used in the national COVID death public reporting and weekly data on the number of people dying in care homes, and through a separate reporting route on the number of care homes with a COVID-19 outbreak. Given the information that CQC already have and publish monthly in their care home directory, it is technically straightforward for CQC to quickly analyse and publish weekly information on:
  1.  COVID-19 and all-cause deaths notified to them, broken down by:
    • Primary care need of the people using the service within which the death took place
    • Age band
    • Type of registered social care service (including care home with nursing, care home, domiciliary care)
    • Location/local authority area (for some types of service), which could also be used for area deprivation indicators
    • CQC ratings (both overall and specific)
    • Number of places (for care homes with nursing and care homes)
    • Organisation running the service
For speed, an analysis of COVID-19 and all-cause deaths of people using social care services supporting people with a primary care need of learning disabilities or autism, broken down by type of social care service and broad age band, could be done first.

     2.  COVID-19 and all-cause deaths notified to them of people detained under the Mental Health Act. This could be done quickly, followed by analyses broken down by ward type according to CQC inspection regimes.

All of the above analyses either have been done secretly, or could be done (and published) straightforwardly.

As I said at the start, I really have tried to be constructive and measured since the start of the COVID-19 pandemic about the lack of information concerning COVID-19 and all-cause deaths of people with learning disabilities and autistic people. All sorts of people and organisations have been scrambling to get sensible information collected and analysed, at unparalleled speed, in very difficult circumstances. 

But this level of wilful obstruction in making basic information available about these groups of people, while ever-more detailed and nuanced information is available on so many other aspects of COVID-19 infections and deaths, really makes me think NHSE/I are trying to hide something. As John Dean, White House Counsel turned whistleblower, said to President Nixon during Watergate "It's not the crime; it's the cover-up that can get you in real trouble."