Friday, 23 June 2023

Vanishing point: When will targets about the number of people with learning disabilities and autistic people in inpatient units be met?

 "Happiness is the target one only has to aim at in order to miss" John Cooper Clarke

There are myriad ways to bring to light the abject failure of governments and services to make good on their promises after the Panorama programme on Winterbourne View, over 12 years ago in 2011. The most important are direct accounts of people's experiences in these places, and how life can be so different with decent support. A small way to add to the picture is to examine, on the government's own terms, whether they are achieving what they say they've set out to do, most obviously in terms of the number of people still in inpatient units.

To keep this blogpost relatively short I won't go over again what has happened, and more especially what has failed to happen, since the Winterbourne View programme first aired. I will just focus on a set of targets that the government has set about the maximum number of children and adults there should be in inpatient units, by the end of March 2024. With less than a year to go until this deadline, how close is the government to meeting the targets they've set? 

The Building the Right Support for People with a Learning Disability and Autistic People Action Plan (2022) restates the NHS Long Term Plan target that “by March 2024 mental health inpatient provision for people with a learning disability and autistic people will reduce to less than half of 2015 levels (on a like for like basis and taking into account population growth). This means that for every 1 million adults, no more than 30 people with a learning disability and autistic people will be cared for in an inpatient unit. For children and young people, no more than 12 to 15 autistic children and young people and children and young people with a learning disability per 1 million children, will be cared for in an inpatient unit.” 

So, these targets (themselves a watering down of targets set in the original Building the Right Support in 2015, and puny in comparison to the aims of the government immediately after Winterbourne View) are expressed in a relatively straightforward way. What's actually happening?


Targets for children

The first graph below shows the number of children (aged less than 18 years) in inpatient units over time, from March 2015 to March 2023 for AT data, and from March 2018 to March 2022 for MHSDS data. 

Without going over this again at great length, AT stands for Assuring Transformation, a set of data collected by health service commissioners and reported every month, which tends to focus on people with learning disabilities and autistic people in 'specialist' inpatient units. MHSDS stands for the Mental Health Services DataSet, which is collected in real time by mental health service providers and reported monthly, which additionally to AT tends to include people with learning and autistic people in mainstream mental health inpatient units. Unfortunately, according to NHS Digital (now being absorbed into NHS England), many mental health service providers have been subjected to a 'recent' cyber attack, meaning that there has been no national MHSDS information since July 2022. You can find all this information here.

Number of children (aged less than 18 years) with learning disabilities and autistic children in inpatient services in England


The second graph below shows the rates per million population (aged less than 18 years) of children with learning disabilities and autistic children in inpatient services. ONS mid-year population estimates were used from 2015-2020 – more recent population estimates were calculated by applying the annual population growth rate from 2015 to 2020.


Rate per million children population of children with learning disabilities and autistic children in inpatient services – England


The first graph shows that according to the AT dataset, 170 children in March 2015 (when the BtRS Action Plan states that the number of children in inpatient services were undercounted) through to 240 children in March 2023 were in inpatient services. There is no clear trend over time, certainly not of reducing numbers of children in inpatient services. The second graph shows that in March 2023 the rate per million of children in inpatient services was 19.4, above the target for 2023/24 of 12-15. On current population figures, the number of children in inpatient services needs to reduce to around 185 children to be within the upper target band and under 150 children to be within the lower target band.

The MHSDS reports smaller numbers of children in inpatient services than AT, from 175 children in March 2018 to 180 children in March 2022. Given that MHSDS figures are usually higher than AT figures, this direction of discrepancy is unusual. It may be that children are less likely to have an already existing health system learning disability or autism flag, which would result in the MHSDS undercounting this group. Again there is no clear trend over time, with recent rates per million child population according to the MHSDS at the level of the upper target band.


Targets for adults

The third graph below shows the number of adults (aged 18+ years) in inpatient units over time, from March 2015 to March 2023 for AT data, and from March 2018 to March 2022 for MHSDS data.


Number of adults (aged 18+ years) with learning disabilities and autistic children in inpatient services in England


The fourth and final graph below shows the rates per million population (aged 18+ years) of adults with learning disabilities and autistic adults in inpatient services. 

Rate per million adult population of adults with learning disabilities and autistic adults in inpatient services – England
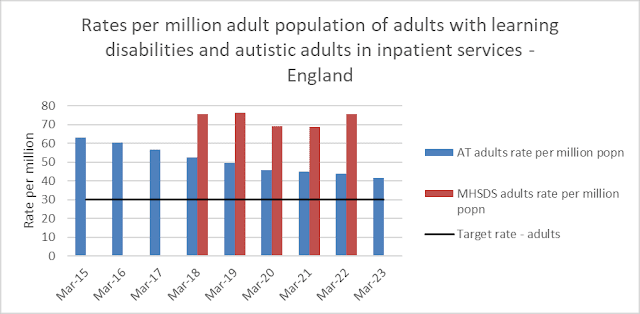

The third graph shows that, according to the AT dataset, 2,735 adults in March 2015 through to 1,890 adults in March 2023 were in inpatient services (although as the March 2023 data is relatively recent it is likely to be a slight underestimate). There is a downward trend over time, at an average compound rate of a 4.5% reduction per year. The fourth graph shows that in March 2023 the rate per million of adults in inpatient services was 41.7, above the target for 2023/24 of 30. On current population figures, the number of adults in inpatient services needs to reduce to 1,360 adults to be within the target band.

Applying the average reduction of 4.5% a year to the 1,890 adults in inpatient units in March 2023, it would take seven years (to March 2030) to reach the Building the Right Support target of 30 per million for March 2024. The downward trend has slowed over time: it was faster for 2015-19 (average compound rate -5.6% per year) than for 2019-2023 (average compound rate -3.6% per year). Applying the more recent -3.6% rate, it would take nine years (to March 2032) to reach the target for March 2024.  

The MHSDS reports higher numbers of adults in inpatient services than AT, with 3,395 adults with learning disabilities and autistic adults reported to be in inpatient services at the end of March 2022. There is no clear trend in numbers over time according to the MHSDS, with lower numbers in March 2020 and March 2021 likely to be related to the COVID-19 pandemic. The rate per million of adults in inpatient services according to the MHSDS was 75.4 in March 2022, very similar to the 75.6 reported in March 2018, compared to the Building the Right Support target of 30 per million. Because there is no existing downward trend over time, there is no future date at which the target rate would be met.


Even on the progressively less demanding terms that the government has set for itself, this is abject failure.


Wednesday, 31 May 2023

Not giving a shit

This is a quick post in response to the heartbreaking inquest for Sally Lewis, which George Julian has been assiduously reporting on in her blog https://www.georgejulian.co.uk/  Sally died as a result of the consequences of prolonged constipation, which despite Sally's 'support' service Dimensions knowing was an ongoing issue for her (and her GP flagging this up to people in the service), almost no-one working with Sally on a daily basis bothered to take seriously. The coroner reported a conclusion of gross neglect, which as those following George's reporting work will know is all too rare when it comes to the deaths of people with learning disabilities.

A final insult to the family is that they are having to crowdfund to pay for legal representation at Sally's inquest, while Dimensions have the funds to pay for lawyer after lawyer - if you have the resources, please consider a contribution https://www.crowdjustice.com/case/justiceforsally/  

In this post I'm just going to provide a short set of links to relevant evidence about constipation and people with learning disabilities, which has been around for some years now. 


1) At least one third of adults with learning disabilities are likely to be experiencing long-standing constipation at any one time, based on research directly assessing constipation.

2) In 2021/22, only 13.1% of people with learning disabilities in England registered with a GP were recorded by their GP to have had diagnosed or treated long-standing constipation in the previous five years - this figure has hardly changed from 2017/18 (13.3%).

3) Richard Handley died from the consequences of chronic constipation in 2012 - his inquest did not take place until 2018. He is by no means the only person with learning disabilities to have died as a result of constipation.

4) Amongst people with learning disabilities, long-standing constipation is one of the most common causes of being taken to hospital in an emergency.

5) Research has reported that over 25% of people with learning disabilities received a repeat prescription for laxatives in one year, compared to 0.1% of people without learning disabilities.

6) Beyond laxatives, there is little research on how to effectively help people with learning disabilities with long-standing constipation, and the evidence there is says that laxatives aren't always that helpful.

7) There is virtually nothing on how supported living and residential care services can support people with learning disabilities to live lives that reduce the chances of long-standing constipation, such as engaging in physical activity and eating healthier diets.

8) In 2019, NHS England identified constipation as a priority for action for people with learning disabilities following a LeDeR report identifying 12 people with learning disabilities dying as a result of constipation. Constipation leaflets were published in 2019, but have not been updated since.

9) In 2016, the Public Health England Learning Disabilities Observatory produced reasonable adjustments guidance (including an easy-read introduction) concerning constipation and people with learning disabilities. Funding for this Observatory stopped in 2019 and this guidance has not been updated since.

10) There are no NICE clinical guidelines relating to constipation and people with learning disabilities.


It's clear there's no reason for services not to know that constipation can be a serious problem for a lot of people with learning disabilities, and that the consequences of long-standing constipation can be fatal. It's also highly revealing that there's very little evidence about helping people live their lives in ways that would make constipation less likely, rather than prescribing laxatives. And it says something quite fundamental that nothing designed to seriously and practically address constipation amongst people with learning disabilities has been sustained. As a very wise colleague and friend said to me recently, how can you make people give a shit?

Sunday, 7 May 2023

How many people with learning disabilities are prescribed mental health medications? Numbers from the 'Health and Care of People with Learning Disabilities' dataset

For over 30 years, it's been clear that huge numbers of people with learning disabilities in England (and in other places too) are prescribed (told by their doctor to take) what are sometimes called 'psychotropic' drugs - drugs that are prescribed to change something about a person's mental state. Typically, these are drugs prescribed for reasons of 'mental health', although they might also be prescribed to change a person's behaviour.

In England, NHS England and other organisations have been running the STOMP programme since 2016. STOMP stands for 'Stopping over medication of people with a learning disability, autism or both'. More recently STAMP ('Supporting Treatment and Appropriate Medication in Paediatrics) has been added by NHS England. Part of the aim of both these programmes is to reduce the number of people with learning disabilities and autistic people who are prescribed these drugs.

This blogpost will simply summarise some recent information about the percentages of people with learning disabilities being prescribed a range of mental health drugs. It mainly uses information from the 'Health and Care of People with Learning Disabilities' dataset, compiled by NHS Digital (now merged into a mega NHS England). Every year (going April to March), this takes information from GP information systems in England to produce statistics about the health and health treatment of people registered with a GP as a person with learning disabilities, often comparing them to the health and healthcare of people without learning disabilities. It's a brilliant source of information that isn't used as much as it should be. The interactive information tool is quite hard to get your head around but it does make it quite flexible - for many things you can look at how things are by age, sex, region and even more locally than that (to Sub Integrated Care Board level, it that floats your boat), and for most things you can look back over the last five years or so. The most recent information available covers April 2021 to March 2022, with updates usually released every year in December.

There are a few cautions to bear in mind though. The biggest one is that the information only covers about 6 in 10 people registered with a GP (59.2%). This is because the information is collected from the electronic information systems that GPs use, and one of the companies that own the electronic information system used by a lot of GPs wanted to charge too much money for it to be used. So coverage across different parts of the country is really patchy. The second caution is that there are likely to be many people with learning disabilities who are not registered as such with their GP - this is even more so for autistic people with registration with their GP as an autistic person (recognising that some people don't want to be registered with their GP in these ways). A third caution is that the extent to which this dataset includes people with learning disabilities in inpatient units really isn't clear. Finally, it's really important to remember that all this information is based on what health systems and GPs record, which is likely to have its own biases, particularly when it comes to people with learning disabilities.


'Severe mental illness' and antipsychotics

Antipsychotics are a set of drugs that are supposed to be prescribed for people with mental health issues with labels such as psychosis, which in GP-record world (along with some other mental health issues) are classed as 'severe mental illness'.

In 2021/22, 7.5% of people with learning disabilities were diagnosed with a 'severe mental illness', compared to 0.9% of people without learning disabilities. A clutch of research projects have shown that mental health issues such as psychosis might be more common amongst people with learning disabilities, but nowhere near to the extent that GPs are diagnosing severe mental illness, with the suspicion that some people with learning disabilities are getting this label to justify them being prescribed antipsychotic drugs for reasons essentially of attempted behavioural control. These percentages haven't changed much from 2017/18 (7.6% of people with learning disabilities; 0.9% of people without learning disabilities.

In terms of sex (the term used in the dataset), more girls/women (8.0% in 2021/22; up from 7.8% in 2017/18) than boys/men (7.2% in 2021/22, down from 7.4% in 2017/18) with learning disabilities had a severe mental illness diagnosis, while there was no difference amongst people without learning disabilities. In terms of age bands, from the age of 35-44 years onwards, more than 10% of people with learning disabilities had a diagnosis of severe mental illness, peaking at 15.8% of people aged 65-74.

Antipsychotics. Overall, in 2021/22 14.5% of people with learning disabilities were being prescribed antipsychotics, compared to 0.9% of people without learning disabilities. For people with learning disabilities, this was a reduction from 15.8% of people being prescribed antipsychotics in 2017/18 (there was no change over time for people without learning disabilities). 

Fewer girls/women with learning disabilities were being prescribed antipsychotics (13.9% in 2021/22, down from 14.4% in 2017/18) than boys/men with learning disabilities (15.0% in 2021/22, down from 16.2% in 2017/18). In terms of age bands, from the ages of 18-24 years onwards, more than 10% of people with learning disabilities in 2021/22 were being prescribed antipsychotics, peaking at 25.3% of people aged 65-74.

More recently, the Health and Care dataset has added information on people being prescribed antipsychotics when they don't have a diagnosis of severe mental illness or palliative care needs. In 2021/22, 9.1% of people with learning disabilities (7.8% of girls/women; 9.9% of boys/men) without a severe mental illness diagnosis were still getting prescribed antipsychotics, compared to 0.5% of people without learning disabilities or a severe mental illness diagnosis. 

Taking into account differences in the populations of people with and without learning disabilities in things like age and sex, in 2021/22 being prescribed antipsychotics was 15 times more common among people with learning disabilities than you would expect from general population prescribing rates; for those without a diagnosis of severe mental illness this rose to being 18 times more common.


Depression and anti-depressants

The Health and Care dataset has very similar information about GP diagnosis of depression and the prescribing of anti-depressants.

Overall, the percentage of people with and without learning disabilities diagnosed with depression has increased over time, at a slightly higher rate for people with learning disabilities (14.5% in 2021/22, up from 13.2% in 2017/18) than people without learning disabilities (13.7% in 2021/22, up from 12.5% in 2017/18).

Amongst people with learning disabilities, girls/women were more likely to be diagnosed with depression (18.4% in 2021/22, up from 16.8% in 2017/18) than boys/men (12.1% in 2021/22, up from 10.7% in 2017/18). In terms of age bands, from the ages of 25-34 years onwards, more than 10% of people with learning disabilities had a diagnosis of depression, peaking at 22.9% of people aged 55-64.

Anti-depressants. Overall, in 2021/22, 21.2% of people with learning disabilities were being prescribed anti-depressants, compared to 10.7% of people without learning disabilities. Girls/women with learning disabilities were more likely to be prescribed anti-depressants (26.0% in 2021/22, compared to 14.2% of girls/women without learning disabilities) than boys/men with learning disabilities (18.1% in 2021/22, compared to 7.2% of boys/men without learning disabilities). In terms of age bands, from the ages of 18-24 years onwards, more than 10% of people with learning disabilities were being prescribed anti-depressants, peaking at 31.8% of people aged 55-64.

For a longer period of time, the Health and Care dataset has also been reporting on people being prescribed anti-depressants when they don't have a diagnosis of depression. In 2021/22, 12.0% of people with learning disabilities without a diagnosis of depression were being prescribed anti-depressants, compared to 4.5% of people without learning disabilities or a diagnosis of depression. For both groups, this had increased since 2017/18 (11.0% of people with learning disabilities without a diagnosis of depression; 4.3% of people without learning disabilities or a diagnosis of depression). Again, this was more common for women with learning disabilities without a diagnosis of depression (13.6% in 2021/22) than men (10.9%). In terms of age bands, from the ages of 18-24 years onwards, more than 10% of people with learning disabilities but with no diagnosis of depression were being prescribed anti-depressants, peaking at 16.7% of people aged 55-64.

Taking into account differences in the populations of people with and without learning disabilities in things like age and sex, in 2021/22 being prescribed antidepressants was twice as common among people with learning disabilities than you would expect from general population prescribing rates; for those without a diagnosis of depression this rose to being 3 times more common.


Other mental health drugs

The Health and Care dataset also reports on other types of drugs used to affect people's mental health or behaviour.

Benzodiazepenes are a type of 'sedative' - they slow down the body and mind and are prescribed for anxiety or sleep problems . In 2021/22, 7.1% of people with learning disabilities were being prescribed benzodiazepenes (down from 7.6% in 2017/18) compared to 1.8% of people without learning disabilities (down from 2.4% in 2017/18). 

Amongst people with learning disabilities, in 2021/22 more women with learning disabilities (7.6%, down from 8.1% in 2017/18) than men (6.8%, down from 7.2% in 2017/18) were being prescribed benzodiazepenes. In terms of age bands, more than 10% of people with learning disabilities between the ages of 45 and 74 were being prescribed benzodiazepenes.

Epilepsy drugs are used to help control seizures, but can also be prescribed to affect someone's behaviour. In 2021/22, 4.9% of people with learning disabilities without an active epilepsy diagnosis were being prescribed epilepsy drugs (down from 5.5% in 2017/18) compared to 2.4% of people without learning disabilities or an active epilepsy diagnosis (stable over time from 2017/18). Amongst people with learning disabilities without an active epilepsy diagnosis, in 2012/22 more women (5.6%) than men (4.4%) were being prescribed epilepsy drugs. 

Taking into account differences in the populations of people with and without learning disabilities in things like age and sex, in 2021/22 being prescribed benzodiazepenes was 5 times as common among people with learning disabilities than you would expect from general population prescribing rates. In 2021/22, being prescribed with epilepsy drugs without an active epilepsy diagnosis was twice as common for people with learning disabilities than you would expect.


Conclusions

These statistics drawn from over half of all people registered with a GP in England, with all their caveats, clearly show that people with learning disabilities continue to be disproportionately prescribed mental health medications, often in the absence of a potentially relevant mental health or other diagnosis. While it might be argued that the STOMP and STAMP initiatives are having some impact on reducing the number of people being prescribed antipsychotics, benzodiazepenes and epilepsy drugs, the increasing numbers of people being prescribed antidepressants is threatening to cancel out any of these gains.

There are also some big gender differences amongst people with learning disabilities, with little sign of these gaps closing over time. And worryingly, given what we know about the side effects of many of these drugs over time, their addictive properties, and their potential impact on how they make people feel, significant numbers of people with learning disabilities are being prescribed these drugs at much earlier ages than people without learning disabilities for potentially longer periods of time.

From the Health and Care dataset. we don't know how many people with learning disabilities are being prescribed more than one mental health drug, although a research project in Jersey suggested that almost a quarter (23%) of people with learning disabilities were being prescribed two or more mental health drugs. We also don't know how many people with learning disabilities in inpatient units are being prescribed these types of medications. Finally we don't know much about what people with learning disabilities and those close to them think about these medications and what impact they have on people's lives - a new research project with co-researchers with learning disabilities is going to ask exactly these questions.

Sunday, 23 October 2022

I am a 9.5 in 10 (with apologies to UB40): social care employment statistics and people with learning disabilities

This blogpost is the third in a set looking at various aspects of the social care statistics recently published by NHS Digital for 2021/22, focusing on adults with learning disabilities in England. The first two blogposts gave an overview of trends in social care support and social care spending for adults with learning disabilities.

This blogpost updates previous posts on what the statistics say about the self/paid employment of working age (aged 18-64 years old) adults with learning disabilities in England. These figures are provided by local authorities every year, and since 2014/15 have only been provided for people getting long-term social care (before 2014/15 it was the larger group of people known to local authorities as a person with learning disabilities, even if they weren't getting long-term social care support). This means that these figures don't include the much, much larger group of adults with learning disabilities who aren't known to local authorities or GPs and who don't get any kind of support related to their learning disability.

It is important to note that these statistics are collected for financial years (April to March), so they will represent what was happening for adults with learning disabilities up to March 2022, through the continuing COVID-19 pandemic in England. It is also really important to say that the quality of this information has been questioned at the best of times – there are massive caveats about the extent to which local authorities would be able to collect this kind of information accurately throughout a pandemic.

Some of the numbers reported here are included in the Adult Social Care Outcomes Framework (indicator 1E, if you're interested), although some of the numbers are more buried in publicly available but less accessible CSV datafiles. 

What do the numbers tell us?

The first graph below shows the number of working age adults with learning disabilities that councils say are in any self/paid employment, broken down by whether people are in employment for 16+ hours per week or less than 16 hours per week (and 1 hour a week can count in these statistics). The gap between 2013/14 and 2014/15 is because of the change in data collection I mentioned earlier, so numbers before and after then can't be compared, and 2008/2009 was the first year that information was collected so it's rather dodgy for that year.


According to these figures, in 2021/22 there were 6,380 working age adults with learning disabilities getting long-term social care in any form of self/paid employment. After a couple of years of the number of people in paid/self employment edging towards 8,000, this is now the lowest number of people in paid employment since the first dodgy year of data collection in 2008/09. Consistent across the years is that most of the people in employment (71% of people in 2021/22) are working for less than 16 hours per week.

What do these numbers mean in terms of employment rates? The graph below shows the employment rates for working age adults with learning disabilities over the same time period. The columns show the overall employment rate - in 2021/22 this was 4.8%, compared to 76% for adults generally in March 2022. This is the lowest employment rate for adults with learning disabilities recorded since the statistics were changed in 2014/15.

The lines on the graph show employment rates for men and women with learning disabilities separately. Employment rates for men (the purple line) are consistently higher (5.3% in 2021/22) than employment rates for women (the blue line) (4.1% in 2021/22 with this gender employment gap staying fairly stable over time.


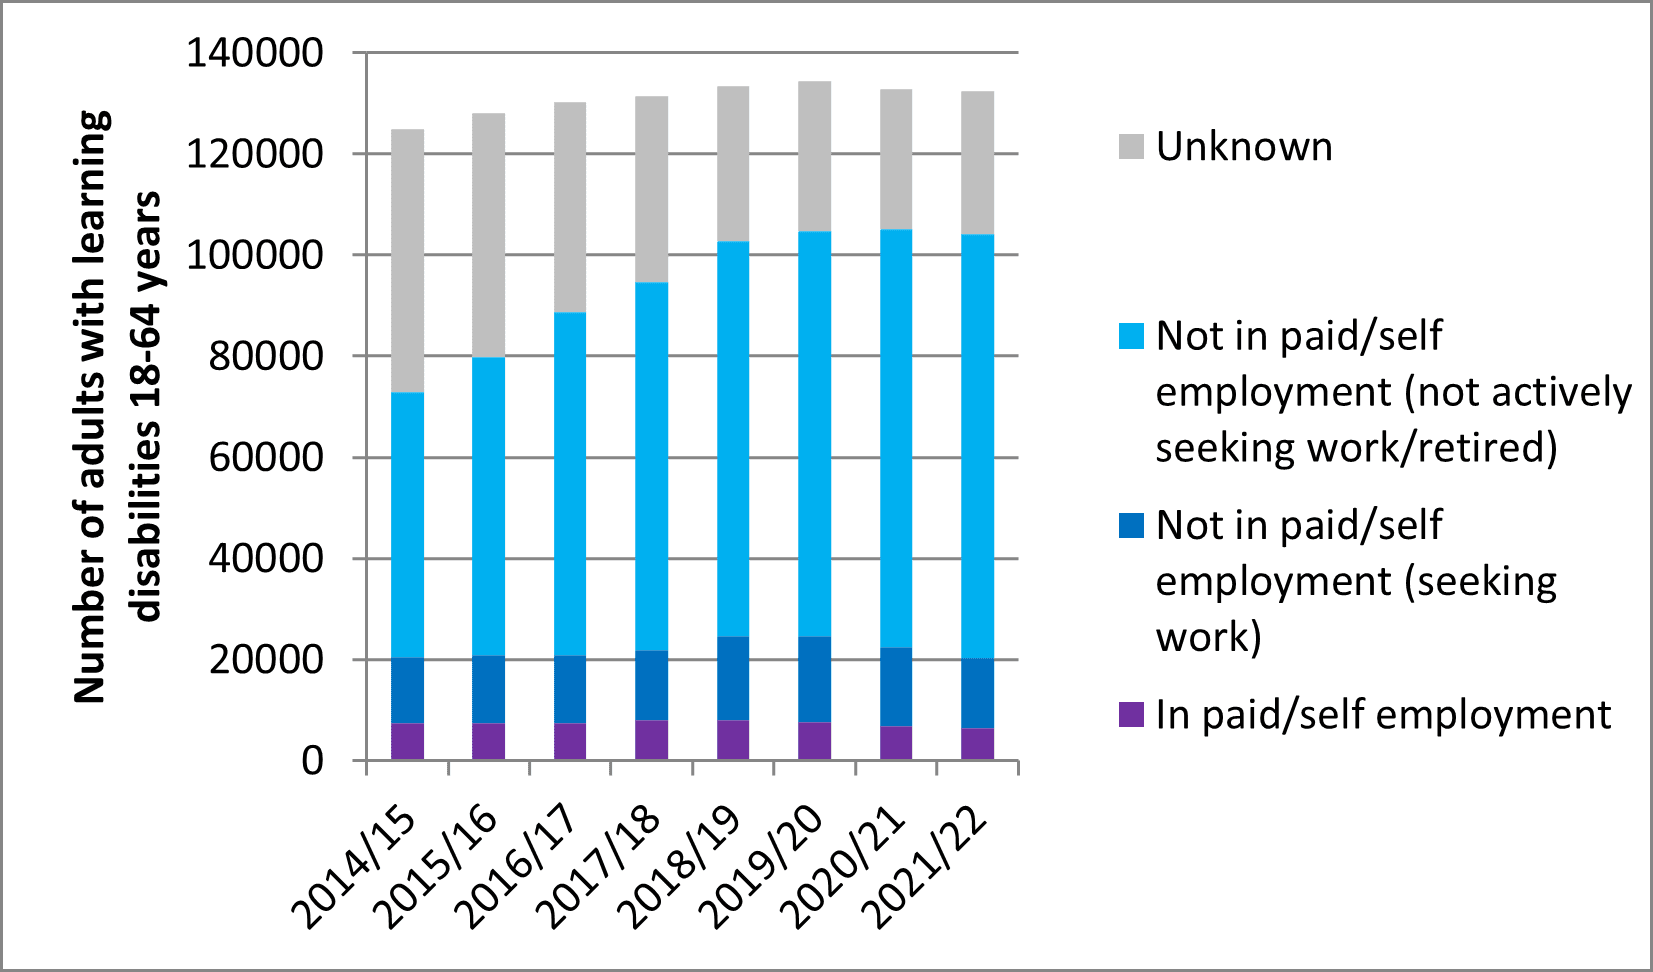
The last graph below sounds an appropriate note of caution about the reliability of information on self/paid employment provided by councils. This shows, for all working age adults with learning disabilities getting long-term social care, whether councils say they are: 1) in self-paid employment; 2) not in employment but actively seeking work (and presumably therefore liable to potential benefit sanctions); 3) not in employment but not actively seeking work. There is also a fourth category, where councils say they don't know the employment status of the person. 


Over time, the number of people whose employment status is unknown has decreased rapidly, from 44% of working age adults with learning disabilities in 2014/15 to 21% of people in 2021/22 (21% is still a big chunk, however). It is unclear how councils are making decisions about whether to record someone as actively seeking work or not.

Overall, this update shows, bearing in mind understandable caveats about the quality of the information that could be collected during the continuing COVID-19 pandemic, further reductions in employment rates (from a ridiculously low base) for working age adults with learning disabilities getting long-term social care, with most work being extremely part-time, and a gender employment gap. 

As far as we know, many more than 5.1% of working age adults with learning disabilities want to work. We know that secure, stable paid employment for people with learning disabilities is associated with better physical and mental health, and we know that supported employment is highly cost-effective. Building sustainable, fulfilling paid employment for people with learning disabilities, in our current circumstances of wide-ranging labour shortages, surely has to be an urgent ‘building back better’ priority? Perhaps the ambitions of the May 2022 Government adult social care reform white paper will be reflected in improved figures next year...

I got bills: Social care spending 2021/22 and people with learning disabilities

NHS Digital have recently released their annual tranche of statistics concerning social care for adults in England. This blogpost is the latest in a series about social care statistics concerning adults with learning disabilities in England, updating the statistics to include the latest 2021/22 figures. Because the reporting year for these statistics runs from April to March, these are the second set of annual statistics that might tell us something about the impact of the COVID-19 pandemic on social care services for adults with learning disabilities. When looking through these statistics it is important to remember the pressures local authorities have been under, which might have affected the quality of the information collected.

Councils with social services responsibilities return information to NHS Digital every year on how many adults are using various forms of social care, and how much councils spend on social care (this doesn’t include other types of state funding relevant to social care, such as housing benefit as part of supported living support). I've tried to use some of the statistics to answer three questions about spending on social care services for adults with learning disabilities (questions relating to how many adults with learning disabilities are using social care are in a previous blogpost).

Question 1: How much money are councils spending on social care services for adults with learning disabilities?

The graph below shows gross expenditure by local authorities on social care for adults with learning disabilities from 2014/15 to 2021/22, broken down by age band and categories of spending. It is important to remember that these figures do not include housing benefit (an essential component of supported living arrangements). These figures are also not adjusted for inflation, which as we enter a time of high inflation is going to be even more important to take into account. However, using 2014/15 as a baseline (there had already been real-terms cuts to social care budgets by this point), the graphs also includes lines of what expenditure would be if social care expenditure only increased in line with inflation, using adult social care inflation figures from the invaluable PSSRU publication Unit Costs of Health and Social Care (2021 edition). 


A couple of observations. Overall, despite the number of adults getting social care decreasing during 2021/22, social services expenditure continued its steady upwards trajectory in absolute terms in 2021/22 at an annual growth rate of 4% from 2014/15. Local authority gross expenditure on social care for adults with learning disabilities totalled £6.5 billion in 2021/22, 30% of all local authority expenditure on adult social care. For both adults with learning disabilities aged 18-64 and adults with learning disabilities aged 65+, increases in expenditure ran slightly ahead of inflation. This indicates local authorities trying to protect these budgets, while at the same time falling short of what would be needed given projected increases in the population of adults with learning disabilities needing social care support.

The two line graphs below show trends in expenditure on specific types of social care service for adults with learning disabilities aged 18-64 and 65+ (with different scales for the two age groups). Spending on supported living continues to increase and has now overtaken spending on residential care - these two are by far the largest components of social care expenditure to support adults with learning disabilities.


Question 2: How much are people paying for social care in 'client contributions'?

When looking at the figures above on expenditure, it is important to remember that this is gross current expenditure - it does not take account of any income that might be coming into local authorities providing social care services. One source of income is 'client contributions' - money for social care support that is paid by people drawing on social care support or those close to them.

The two graphs below show the amount of income received by local authorities in client contributions for different types of social care support, for services for adults with learning disabilities aged 18-64 and for adults with learning disabilities aged 65+. As with the earlier overall expenditure graph, using 2014/15 as a baseline the graphs also includes lines of what expenditure would be if client contributions for social care only increased in line with inflation, using adult social care inflation figures from the PSSRU publication Unit Costs of Health and Social Care (2021 edition). 

For both adults aged 18-64 and adults aged 65+, the biggest types of client contributions were for residential care and contributions under the 'fairer charging' regimen and its successors. Also for both age groups, client contributions over time have increased faster than inflation, and in total added up to £472.7 million in 2021/22, representing 7% of total gross social care spending.


Question 3: Are unit costs changing over time?

Unit costs for residential care and nursing care for adults with learning disabilities continued their upward trend in 2021/22 for adults aged 18-64. For adults aged 18-64, the average cost to local authorities of residential care was £1,726 per person per week and nursing care £1,568 per person per week. Unit costs were cheaper in 2021/22 for adults aged 65+ compared to adults aged 18-64 (£1,155 per person per week in residential care; £792 per person per week in nursing care), with unit costs decreasing for adults aged 65+ from 2020/21 to 2021/22. It is worth noting that unit costs are higher for these services for adults with learning disabilities aged 18-64 than for any other group of people getting social care.


Summing up

Social care spending for adults with learning disabilities reported in 2021/22 seems to continue longer-term trends, with increases just above inflation, continued increases in spending on supported living, and both supported living and residential care being the biggest types of social care spending. Client contributions also continue to rise faster than inflation year-on-year. There is a more mixed picture when it comes to the unit costs of residential and nursing care.

Given that there were 2,275 fewer adults getting social care at the end of March 2022 compared to the end of March 2020, with high inflation and staff shortages a present reality, what kind of a future are councils planning for? How much are councils spending on block contracts irrespective of whether people want to live there, and on 'voids' where people aren't even living? A future combining a high eligibility barrier with expensive, restrictive service options predominating seems the very opposite of value for money.


Friday, 21 October 2022

The missing thousands - social care statistics 2021/22 and people with learning disabilities (1)

NHS Digital have recently released their annual tranche of statistics concerning social care for adults in England. This blogpost is the latest in a series about social care statistics concerning adults with learning disabilities in England, updating the statistics to include the latest 2021/22 figures. Because the reporting year for these statistics runs from April to March, these are the second set of annual statistics that might tell us something about the impact of the COVID-19 pandemic on social care services for adults with learning disabilities. When looking through these statistics it is important to remember the pressures local authorities have been under, which might have affected the quality of the information collected.

Councils with social services responsibilities return information to NHS Digital every year on how many adults are using various forms of social care, and how much councils spend on social care (this doesn’t include other types of state funding relevant to social care, such as housing benefit as part of supported living support). I've tried to use some of the statistics to answer four questions (questions relating to social care spending and employment will be in two follow-up blogposts).

Question 1: How many adults with learning disabilities were getting access to social care in 2021/22?

From 2014/15 the types of long-term social care support people get have been grouped into one of six mutually exclusive categories: residential care, nursing care, direct payment only, support via a personal budget partly including a direct payment, a council-managed personal budget, and council-commissioned community support only.

The first graph below shows the number of adults with learning disabilities aged 18-64 getting various types of personal budget or council-commissioned community support at some point during the year from 2014/15 to 2021/22), and also the number of adults aged 18-64 in residential or nursing care.


This graph suggests that some trends evident from 2014/15 to 2018/19 (before the COVID-19 pandemic) for adults with learning disabilities aged 18-64 have continued through to 2021/2022, while other trends have changed pace or reversed. 

Residential care has continued to reduce year-on-year from 26,975 people in 2014/15 to 21,880 people in 2012, as has nursing care (1,265 people in 2014/15 through to 1,035 people in 2021/22). The number of people getting social care in the form of direct payments increased from 2014/15 (21,580 people) to 2020/21 (28,015 people), but has levelled off in 2021/22 (27,930 people). The number of people getting social care at least partly in the form of a direct payment increased from 2014/15 (13,265 people) to 2019/20 (17,255 people), but has decreased since (16,265 people in 2021/22). The most common form of long-term social care support was the council-managed personal budget (the extent to which many of these feel any different to council-commissioned community services is debatable), which continues to increase over time (from 49,150 people in 2014/15 to 61,530 people in 2021/22). Finally, while the number of people getting council-managed community support decreased substantially from 2014/15 (12,000 people) to 2020/21 (4,900 people), this number increased sharply in 2021/22 (8.090 people).

In terms of residential and nursing care, the graph shows that although the number of adults aged 18-64 in residential care and nursing care continues to gradually decline over time, in 2020/21 they still represented 17% of all adults with learning disabilities aged 18-64 getting long-term social care.

In total 132,465 adults with learning disabilities aged 18-64 were getting long-term social care at some point in 2021/22. While there had been a steady trend of increasing numbers of adults with learning disabilities getting long-term social care year on year from 2014/15 to 2019/20, from 2019/20 to 2021/22 there have been two years of decreases in these numbers - there were 2,965 fewer adults with learning disabilities aged 18-64 getting long-term social care at some point in 2021/22 than in 2019/20. 

The second graph below presents the same information for adults with learning disabilities aged 65+. Please note that, because the number of people with learning disabilities aged 65+ using social care is much smaller compared to people aged 18-64, I have used a different vertical scale.


Unlike the figures for adults with learning disabilities aged 18-64, there is a continuous year-on-year upward trend in the numbers of adults with learning disabilities aged 65+ getting long-term social care, from 14,570 people in 2014/15 through to 18,405 people in 2021/22. 

The upward trend for the number of people in residential homes and nursing homes was interrupted in 2020/21 with a slight dip, but has resumed from 2020/21 to 2021/22, when 5,830 people were in residential homes and 860 people were in nursing homes. People getting long-term social care in the forms of direct payment only (620 people in 2014/15; 1,065 people in 2021/22), part direct payment (505 people in 2014/15; 785 people in 2021/22), and council-managed personal budgets (5,920 people in 2014/15; 9,350 people in 2021/22), with occasional fluctuations, have continued to trend upwards over time. The number of people getting council-commissioned community support has continued to decrease over time (1,430 people in 2014/15; 515 people in 2021/22).

For adults with learning disabilities aged 65+ getting long-term social care, 36% were getting this care in the form of residential or nursing care.

However, the statistics I’ve presented so far are for people getting long-term social care at some point in each year. This may under-estimate the impact of COVID-19 on the number of people currently getting social care, particularly where people have died during the year. The NHS Digital statistics also have snapshot figures on the number of people with learning disabilities getting adult social care at the end of each financial year, which we can compare to the number of people getting social care at some point during the year. The graph below shows this information for adults with learning disabilities aged 18-64, from 2014/15 to 2021/22. In 2020/21 and 2021/22, there is a clear reversal in the upward trend, with both people getting long-term social care at some point in the year (132,465 people) and people getting long-term social care support at the end of the financial year (124,635 people) falling for two consecutive years.


The next graph below shows the same information for people aged 65+, with a different pattern to people aged 18-64. The number of people getting long-term social care support at some point in the year continues to increase into 2021/22. The number of people getting long-term care at the end of the 2020/21 financial year dropped from 2018/19 to 2020/21, but increased again from 2020/21 to 2021/22. 


While these statistics are difficult to interpret, there were 2,275 fewer adults with learning disabilities of all ages getting long-term social care at the end of March 2022 compared to the same time two years before.

There is also the question of whether the number of adults with learning disabilities getting long-term social care is increasing in line with projected increases in the number of adults with learning disabilities needing social care. The graph shows the total number of adults with learning disabilities aged 18+ getting long-term social care support at any time in the year and at the end of each year, using the same overall format as the graphs above. Added to the graph are projected numbers of adults with learning disabilities requiring social care support, taken from population projections published in 2012 and baselined for 2014/15. There are two projections using dashed lines - the dark blue dashed line is the number of adults with critical or substantial needs only, and the light blue dashed line is for the number of adults with critical, substantial or moderate needs. 


As the graph shows, up to 2018/19 the number of adults getting long-term social care was just about keeping pace with the projected numbers of adults with critical or substantial needs (which is drawing the eligibility hurdle really quite high), but by 2021/22 the gap between the number of people projected to need social care and those actually getting social care was around 10,000 people. The gap is even greater if you take the projected number of adults with learning disabilities with critical, substantial or moderate needs (a gap of around 19,000 people in 2021/22).


Question 2: Where are people with learning disabilities living?

The headline social care statistics only report the living situations of people living in residential care and nursing homes (social care support for people in other living situations is characterised by whether they’re getting council-commissioned support or some form of personal budget). The number of adults with learning disabilities in residential and nursing care from 2014/15 to 2021/22 is in the graph below, broken down by whether people are aged 18-64 or 65+. For people aged 18-64, the trend is for a substantial decrease in the number of people living in residential care – a reduction of 19% in 7 years, with a similar percentage drop (18%) for adults aged 18-64 in nursing care. For adults with learning disabilities aged 65+, the number of people in residential care and nursing care has been gradually increasing up to 2019/20 (although with dips in 2017/18 and 2020/21). 


More hidden in the social care statistics is more detailed information on where local authorities think that adults with learning disabilities aged 18-64 who are getting long-term social care are living (a holdover indicator introduced, along with employment, with Valuing People). The monster graph below stacks up all the different types of living situation, from 2014/15 to 2021/22 (again note the ominous decreases in 2020/21 and 2021/22). 


To hopefully make this a bit more digestible, I’ve picked out trends for the most common types of living situation in the graph below. As the graph shows, the most common (and increasing up to 2019/20) living situations for adults with learning disabilities aged 18-64 were not residential or nursing care. By far the most common living situation was people living with their families (47,835 people in 2021/22; 36% of people recorded in this database). Over 30,000 people were living in some form of supported accommodation in 2021/22 (31,960 people; 24%), over 20,000 people were tenants or owner-occupiers (20,035 people; 15%) and 3,375 people (3%) were living in a Shared Lives arrangement. Throughout the COVID-19 pandemic adults with learning disabilities in all these living situations (and that’s without thinking of the majority of adults with learning disabilities, who do not get any social care support) were not exactly at the front of the queue when it came to government guidance, support with PPE and the essentials of daily life, repurposing much-needed social care support, and support to ensure that support workers could minimise the COVID-19 risks to themselves and the people they were supporting. 


Question 3: What happened to people trying to get a social care service?

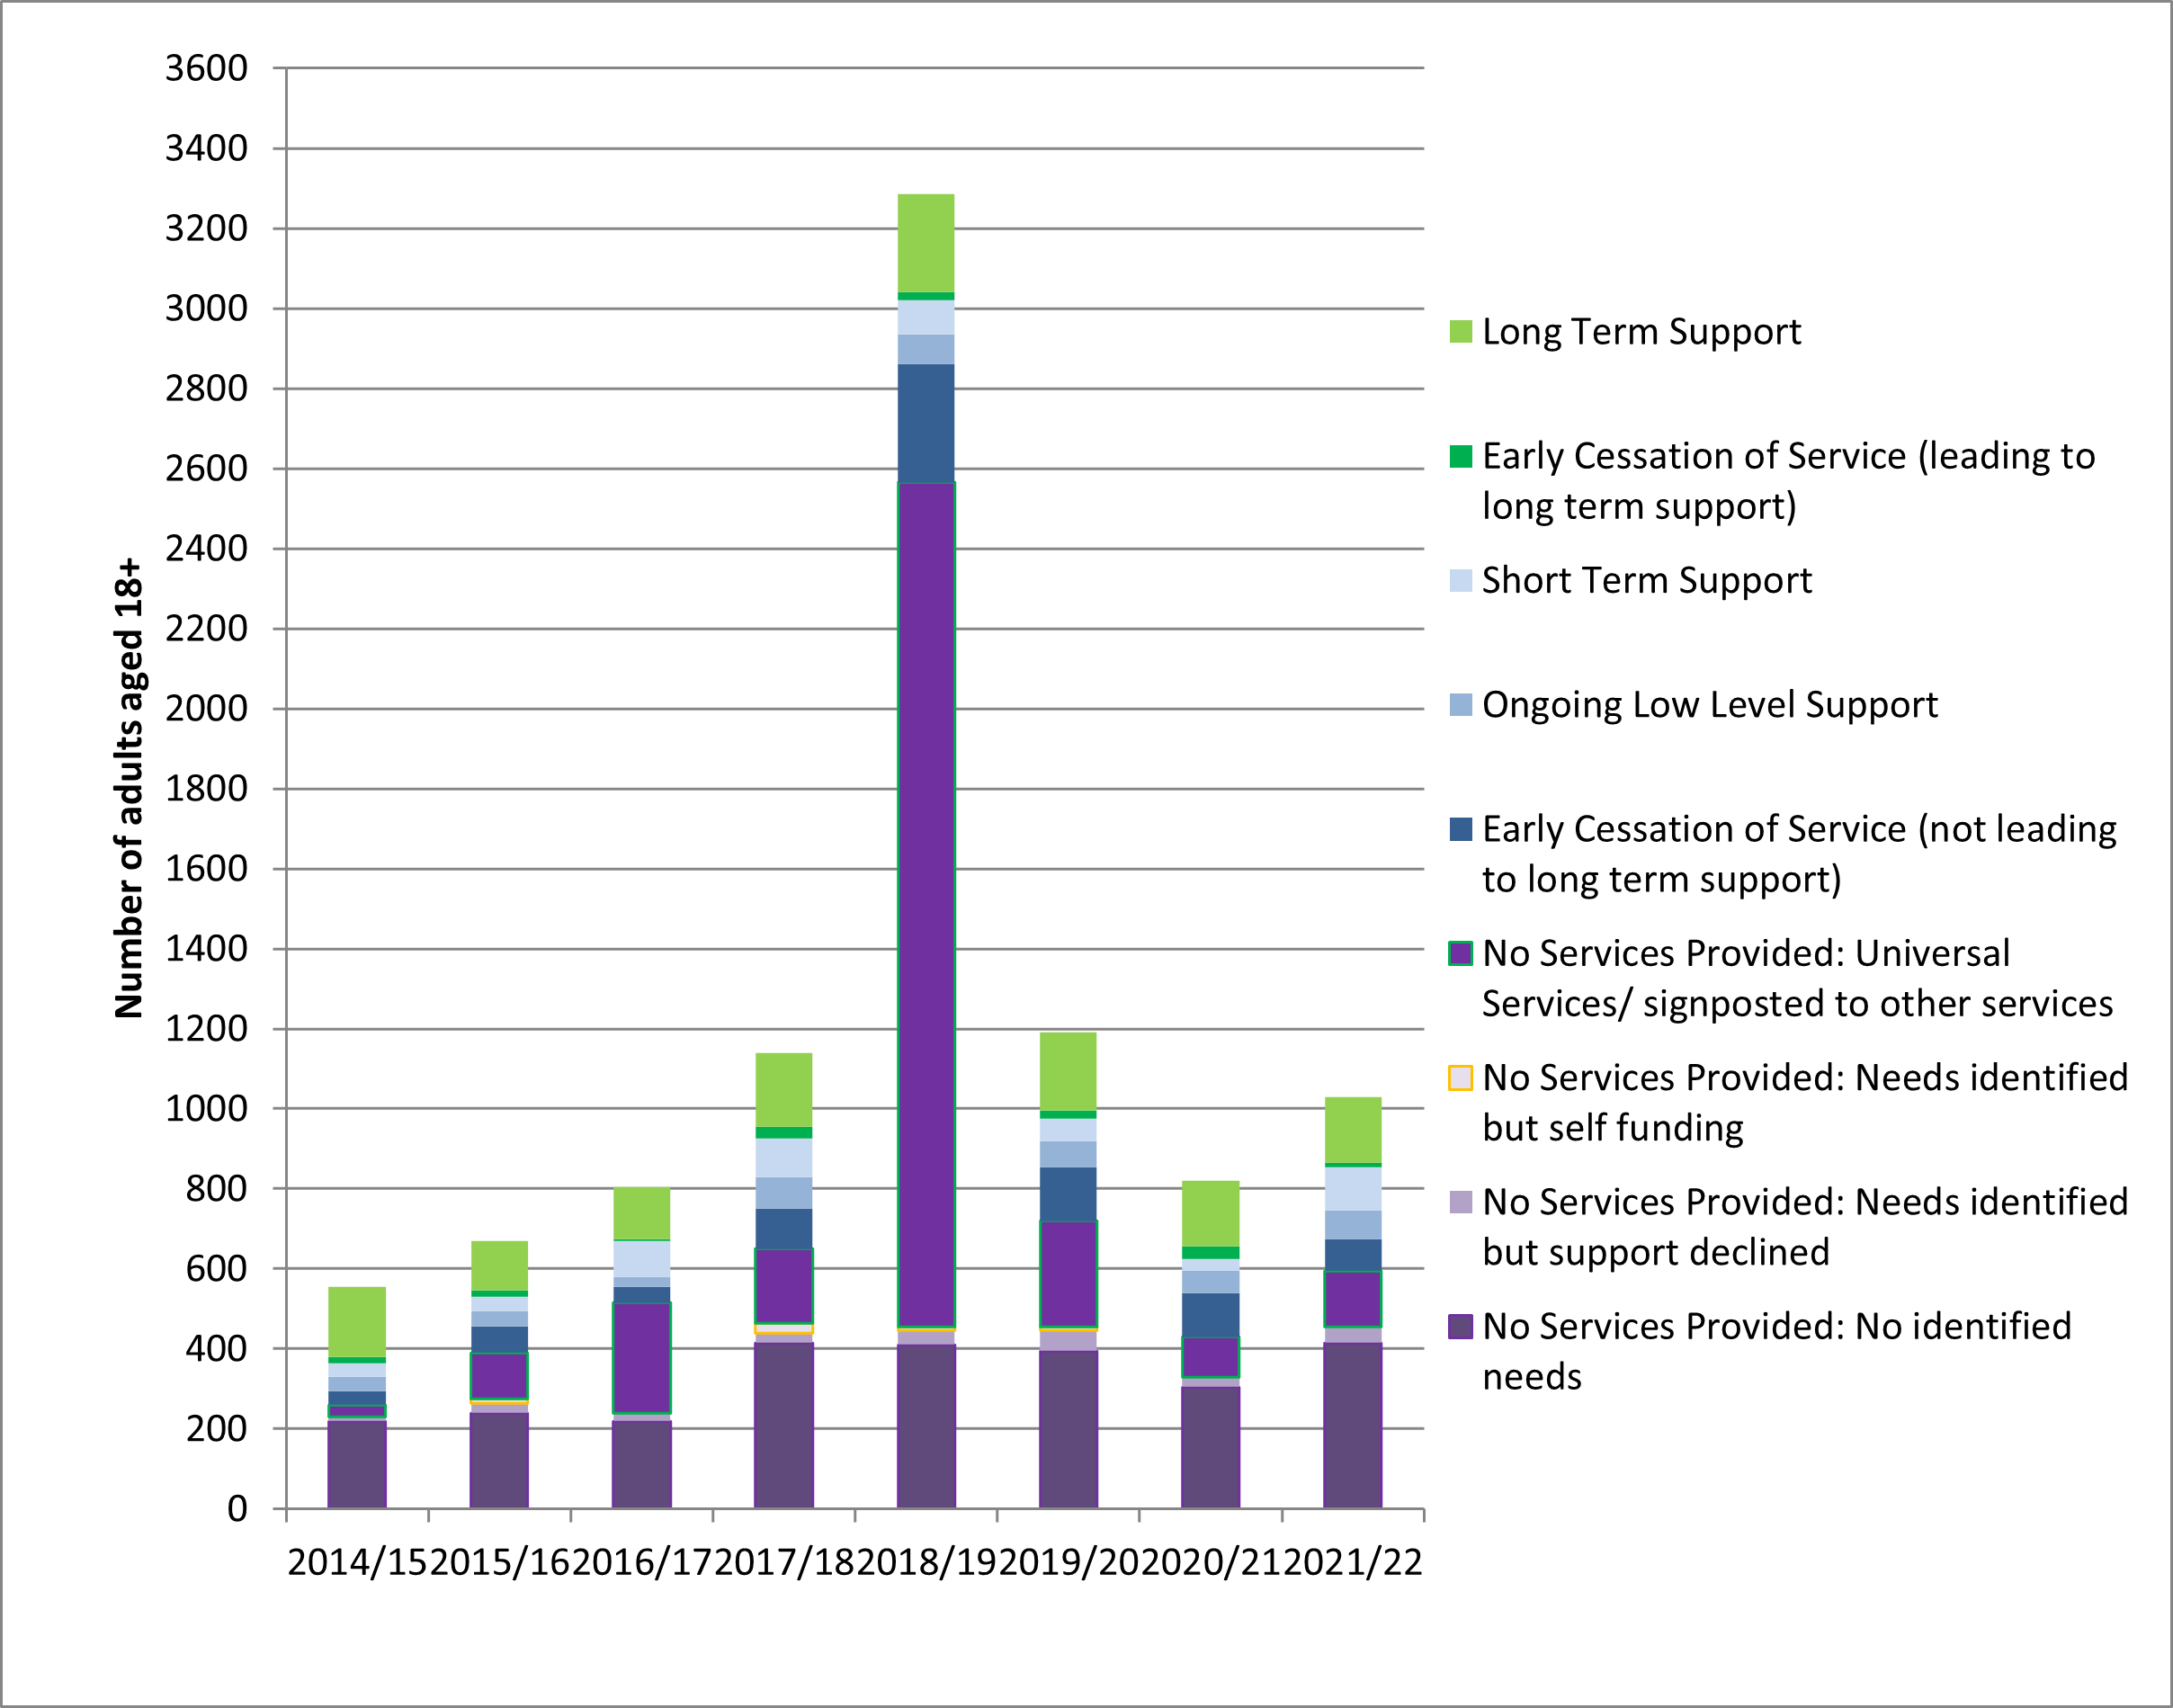
Although it is limited, adult social care statistics also include information on new people coming to the attention of social care services, and what happens to them after a ‘completed episode of short-term care to maximise independence’ (which to my untutored eye looks functionally equivalent to assessment). The graph below shows this information for all adults with learning disabilities aged 18+, from 2014/15 to 2021/22. Looking at the graph, 2018/19 looks like a bit of an anomaly, largely due to much higher numbers of people being signposted to universal services or other forms of non-social care support than in any other year. There seems to be an upward trend in the number of adults with learning disabilities coming to the attention of social services from 2014/15 to 2018/19, followed by a decrease from 2018/19 through to 2020/21, and a recent increase from 2020/21 to 2021/22 (although not to the levels of 2019/20).

In terms of what was happening in 2021/22, 1.030 adults with learning disabilities (almost all of whom were aged 18-64) came to social services as new clients.

Of these, 40% (415 people) were identified as having no needs and therefore requiring no services. For 14% (140 people) the response from social services was to signpost people to universal services or other forms of non-social care support. Almost one sixth of people (180 people; 17%) went on to get some form of low level or short-term support from social care, with a similar number (175 people; 17%) going on to get some form of long-term social care support. Very few (40 people; 4%) declined a service that was offered. 


Throughout the two years of the pandemic, the number of adults with learning disabilities coming to the attention of social care has been lower than in any of the previous three years, with a minority of this group getting any form of social care support during the COVID-19 pandemic beyond signposting elsewhere. 

Question 4: What do adults with learning disabilities think about the social care services they're getting?

At the same time as the publication of the 2021/22 social care statistics, information from the latest Personal Social Services Adult Social Care Survey for 2021/22 was also released by NHS Digital. This is administered by councils to thousands of adults making use of social care services every year, and asks (in carefully developed and tested standard and easy read formats) a range of questions about people's experiences of social care services and about people's wellbeing and health.

The graph below presents information from this survey from 2014/15 to 2021/22 for three groups of adults getting social care services; people with a primary care need of learning disabilities, people with a primary care need of physical support, and people with a primary mental health care need. The responses to four questions are summarised in the graph. For most groups, in response to the four questions at almost all time points there is little change over time (the exception being the percentage of people with learning disabilities saying they were not depressed or anxious, which increased by 16% in 2018/19 and has stayed at this higher level since), and overall people with learning disabilities report a consistently much more positive experience than the other two groups of people.

The general lack of change over this time period, when things have got harder for a lot of people getting social care and including the COVID-19 pandemic (although many groups were marginally more positive in 2020/21, at the height of lockdowns, than before or since), reinforces other research suggesting that these kinds of questions can be relatively insensitive to changes in people's circumstances.

The higher positivity of people with learning disabilities may be a genuine difference - it may also partly be a function of different question formats (people with learning disabilities are more likely to answer easy read format questions than other groups), and partly because people with learning disabilities were more likely to get help to answer questions, particularly from care workers, than the other two groups.


Summing up

To sum up, it seems like the continuing impact of the COVID-19 pandemic and the response of social care services to the pandemic has magnified some longer term trends in social care services, while putting other trends into reverse. The big, and grim, difference is that 2,275 fewer adults were getting long-term social care at the end of March 2022 compared to the end of March 2020, reversing a long-term trend of year-on-year increases. The gap between the number of adults with learning disabilities likely to need social care support and those getting social care support is now into the tens of thousands. This is particularly acute amongst adults aged 18-64 rather than adults aged 65+. Fewer requests for social care support are coming through to local authorities, and only a minority of these requests result in social care support.

There is also a question about how sensitive these statistics are to the seismic changes to people’s social care support that people with learning disabilities have been reporting throughout the COVID-19 pandemic. For example, in the Coronavirus and people with learning disabilities project many people reported paying for social care services they weren’t currently getting, getting less of a service than they used to, or some services which involved going out being replaced by online services, none of which would be picked up by these statistics. This research project also reports changes to people's health and wellbeing over time that are not being picked up by the Adult Social Care Survey.


Tuesday, 23 August 2022

Why don't NHS England want to know about over 1,000 people in inpatient services?

NHS England are doing another consultation of changes they are making to the information they collect in the Assuring Transformation dataset about the number of people with learning disabilities and autistic people in inpatient services. It's for data gatherers and is not accessible https://nhs-digital.citizenspace.com/standards-assurance/assuring-transformation-data-collection-v4/ 

This consultation describes the Assuring Transformation (AT) dataset as the 'definitive source of information on inpatient numbers and activity'. This short blogpost is me, once again, with a reminder that this is not the case. There is another dataset routinely collected by mental health service providers, called the Mental Health Services Dataset (MHSDS), that is much more comprehensive in its coverage. I'll try and show why this matters by just looking at figures at the end of May 2022 (the most recent information we have).

At the end of May 2022, AT reported that there were 2,075 autistic people and people with learning disabilities in inpatient services. MHSDS reported there were 3,205 people, over 50% and 1,000 people more than the AT dataset. If you're redesigning a national plan, would you not be interested in these extra 1,000 people? 

If you look at the figures for specific provider organisations, the biggest discrepancies in reporting are in the organisations with the most people with learning disabilities and autistic people in their inpatient services. So, here's a list of the organisations where there's a discrepancy of 50 or more people between the AT and MHSDS datasets - many of these will be names you recognise:

Cygnet Healthcare Ltd.    AT - 195 people     MHSDS - 360 people 
(so 165 autistic people and people with learning disabilities in their inpatient services are not visible in the AT dataset, and presumably invisible to the commissioners that provide the data for AT)

Elysium Healthcare.        AT - 160 people    MHSDS - 235 people (75 people invisible to AT)

Partnerships in Care Ltd. AT - 95 people       MHSDS - 170 people (75 people invisible to AT)

Priory Group Ltd.            AT - 130 people    MHSDS - 65 people
(this is one of a small number of organisations where there are more people recorded in the AT dataset than in the MHSDS, so presumably there are people in inpatient services according to AT that don't count as mental health services according to the MHSDS???)

St Andrews Healthcare.   AT - 110 people    MHSDS - 170 people (60 people invisible to AT)

The Huntercombe Group.  AT - 90 people    MHSDS - no people (again, seems very odd)


Birmingham and Solihull Mental Health NHS Foundation Trust.
                                     AT - 15 people        MHSDS - 75 people (60 people invisible to AT)

Bradford District Care NHS Foundation Trust.
                                     AT - no people        MHSDS - 80 people (80 people invisible to AT)

Cumbria, Northumberland, Tyne and Wear Foundation NHS Trust.
                                     AT - 75 people       MHSDS - 145 people (70 people invisible to AT)

Greater Manchester Mental Health NHS Foundation Trust.
                                     AT - 20 people       MHSDS - 80 people (60 people invisible to AT)

Mersey Care NHS Foundation Trust.
                                     AT - 95 people    MHSDS - 145 people (50 people invisible to AT)

Nottinghamshire Healthcare NHS Foundation Trust.
                                     AT - 80 people    MHSDS - 155 people (80 people invisible to AT)


For some of the NHS Trusts in particular, some of this discrepancy is likely to be because they run generic mental health inpatient services, where people are usually inpatients for relatively short periods of time, and who the MHSDS dataset is much better at picking up than the AT dataset. And for areas looking to reduce reliance on long-stay 'specialist' inpatient services, this might be a deliberate and potentially defensible strategy. But this is highly unlikely to be the case for the private sector organisations on this list. What is going on there, and when the discrepancies between the two datasets have been known for years (and complained about repeatedly by the National Audit Office), why hasn't NHS England got this sorted out?

And meanwhile, over 1,000 people with learning disabilities and autistic people in inpatient services, at a stroke of a computer key, are rendered invisible.